Report Location: Accountability Lead4ward
Usage: This guide explains how campus and district leaders can use OnDataSuite to generate a STAAR-only version of the lead4ward Leadership Report Card (LRC). The LRC provides a concise, data-informed summary to guide instructional leadership decisions, leveraging key performance metrics to identify strengths, areas of concern, and student group trends.
The lead4ward LRC is designed to:
- Identify performance trends over time
- Highlight gaps among student groups
- Support strategic planning and targeted interventions
- Build shared understanding of assessment results across leadership teams
When using STAAR-only data, the focus remains on core accountability-tested content areas: Reading/ELA, Math, Science, and Social Studies.
Data Sources – PEIMS Summer Records, STAAR Data
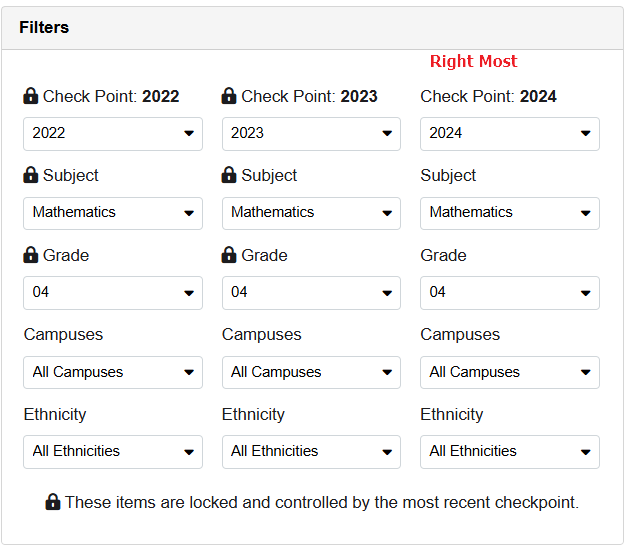
Filters: There are three sets for STAAR, for different years. The right-most checkpoint will update the other checkpoints. Locks help ensure the Teks stay aligned across grade levels, etc.
Checkpoints: Designated points in time (e.g., beginning, middle, end of the year) used to compare student performance across assessments in this case, STAAR, across several years.
Three checkpoints include:
- Subject
- Grade
- Campuses
- Ethnicity
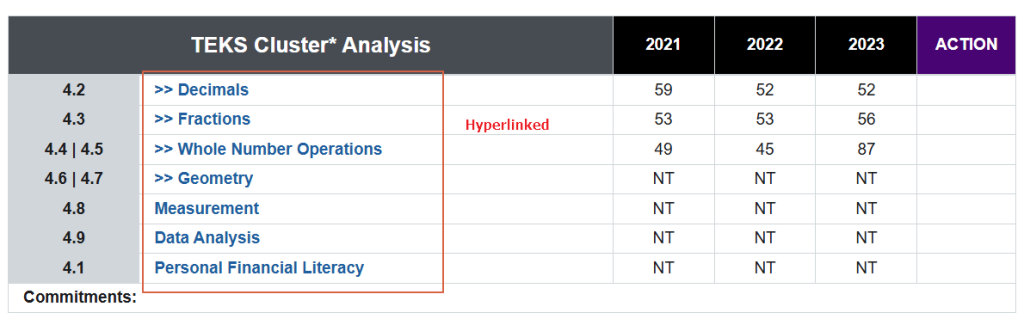
Special Notes: Teks Cluster Analysis is hyperlinked to the detailed information.
TEKS Cluster Analysis: A grouping of related Texas Essential Knowledge and Skills (TEKS) standards to analyze student performance in specific content areas.
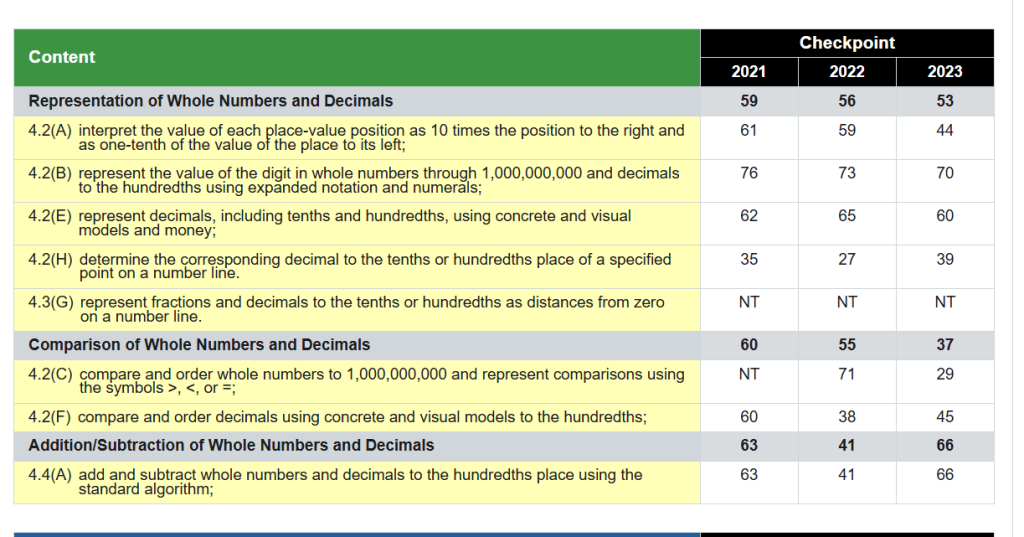
How Color Is Determined for Percentages
The color shown for a percentage is not based on fixed cutoffs (for example, “red below 50% and green above”).
Instead, the color changes smoothly as the percentage increases.
Percentage → Color Mapping
| Percentage | Color Appearance | Meaning |
|---|---|---|
| 0% | 🔴 Red | Lowest performance |
| 25% | 🟠 Orange-red | Below midpoint |
| 49% | 🟡 Nearly yellow | Approaching midpoint |
| 50% | 🟡 Yellow | Midpoint |
| 51% | 🟢 Yellow-green | Above midpoint |
| 75% | 🟢 Light green | Strong performance |
| 100% | 🟢 Green | Highest performance |
Important Notes
- The scale is continuous, not categorical
- Colors blend smoothly as percentages change
- There is no hard “red/yellow/green” cutoff
- Very close values may appear almost the same color
💡 This gradient helps users quickly interpret progress and performance without abrupt color jumps.
Color Ranges (Conceptual)
- 0–49% → Red to Yellow
- 0% = Red
- 25% = Orange-red
- 49% = Almost yellow
- 50% → Yellow
- Exactly 50% displays as yellow
- 51–100% → Yellow to Green
- 51% = Yellow-green
- 75% = Light green
- 100% = Green
Key Takeaway
There is no strict color threshold.
Each percentage value is calculated individually and assigned a color on a continuous gradient, ensuring smooth visual transitions and a more precise representation of performance.