
📍 Report Location
Accountability > Federal Accountability
👤 Summary
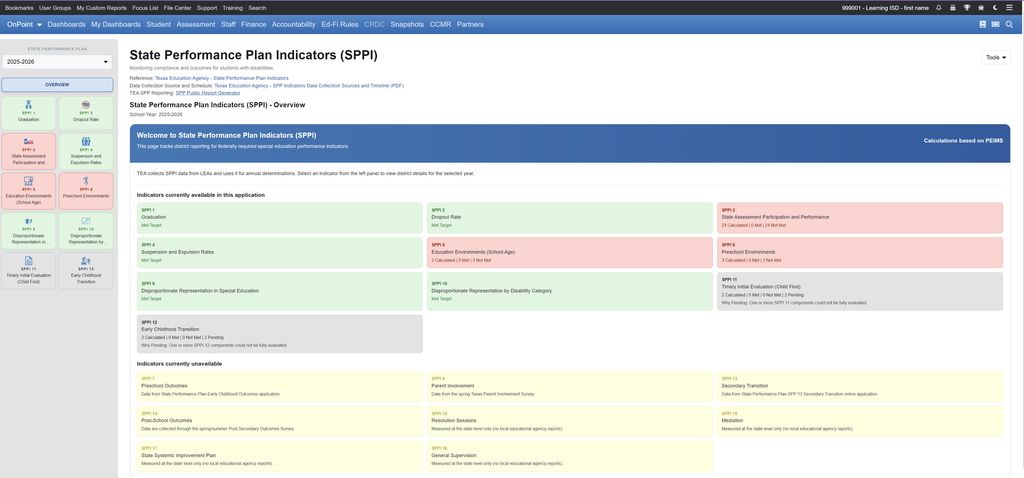
The State Performance Plan Indicators (SPPI) report provides a centralized dashboard view for monitoring compliance and educational outcomes for students receiving special education services in Texas. The report offers an Overview summary matrix of all indicators as well as dedicated Individual Indicator Views via interactive side-panel tiles, allowing users to evaluate school system performance against state targets across selected reporting school years.
💡 Usage
- Select Reporting Year: Choose the desired State Performance Plan school year from the drop-down menu in the left navigation panel.
- Overview View (Default Screen):
- Click the OVERVIEW button in the left menu to display the full summary landing page.
- Review all available SPPI indicators at a glance, including target designation.
- Color-Coded Status Shading: Overview cards and side-panel tiles are color-coded to provide an immediate status check:
- 🟩 Green: All rated targets met.
- 🟥 Red: At least one target not met (includes counts of how many targets not met)
- ⬜ Gray: No targets rated (e.g., pending evaluation or state-level/external collection).
- Color-Coded Status Shading: Overview cards and side-panel tiles are color-coded to provide an immediate status check:
- Indicators Currently Unavailable: Certain SPPI indicators (SPPI 7, 8, 13, 14, 15, 16, 17, and 18) are displayed under the Indicators currently unavailable section on the Overview screen. These indicators are measured exclusively at the state level or collected through external applications/surveys (e.g., Parent Involvement Survey, Post-Secondary Outcomes Survey, SPP-13 Online Application).
- Individual Indicator View:
- Click any specific indicator tile in the left navigation panel (e.g. SPPI 1: Graduation, SPPI 6: Preschool Environments) to view its dedicated reporting page.
- Definition and Purpose identified at the top of every indicator
- Monitor Compliance: Review calculated school system rates against state standard targets to verify whether targets were met.
🧭 Special Notes
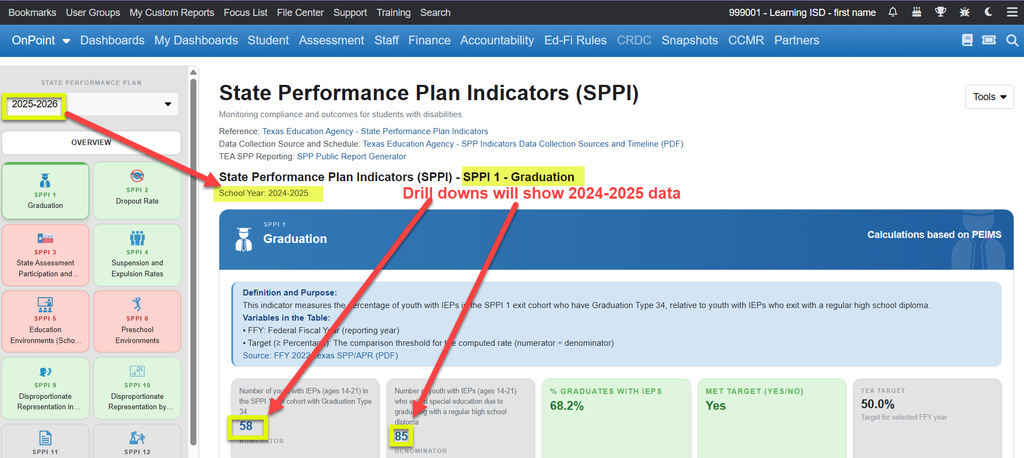
- The School Year shown at the top of the individual indicators signifies the year of the data being evaluated and doesn’t always match the State Performance Plan year filter. The drill down year will match to the school year shown in the individual tile.
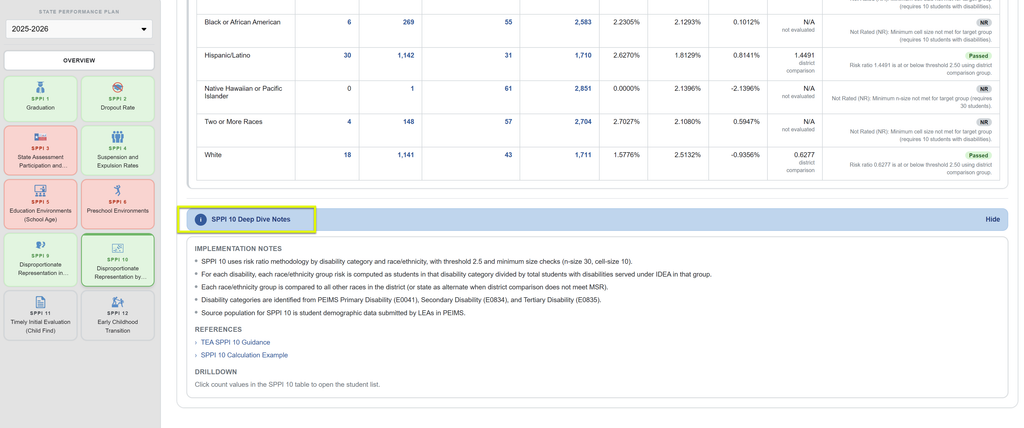
- Additional context and underlying rule logic can be found by expanding the SPPI Deep Dive Report Notes section at the bottom of each selected indicator view.
🚦 Data Source(s)
- PEIMS Submissions
📄 Definitions
- SPPI (State Performance Plan Indicators): Federal performance indicators required under IDEA that measure special education program performance and compliance across state educational agencies.
- FFY (Federal Fiscal Year): The designated reporting year for federal SPP/APR performance metrics.
- Target: The comparison threshold or percentage established by TEA for computed rates.
🧮 Calculations
- Metrics vary dynamically based on the selected indicator tile. Depending on the indicator, displays may include:
- Single-Metric Summaries: Numerator / Denominator calculations compared against a single target rate (e.g., SPPI 1).
- Multi-Category/Subpart Tables: Complex breakdowns (e.g., SPPI 6 subparts 6A, 6B, 6C) evaluating student counts, percentages of total denominators, and rule-based status evaluations (
>=or<=).
✨ Features
- Interactive Indicator Tiles: Fast switching between TEA performance indicators on a single screen.
- Dynamic Metric Displays: Displays high-level summary cards, subpart breakdown tables, and status flags (e.g. MET TARGET / NOT MET).
- Availability Tracking: Clearly separates active system-calculated indicators from externally reported or state-only indicators.
- Drill Down on numerator/denominator/student links to see student detail lists
- Tools Menu Options:
- Print to PDF: Generates a print-friendly summary of the active indicator screen.
- Bookmark: Saves the active report view and year filter selected for quick future reference.