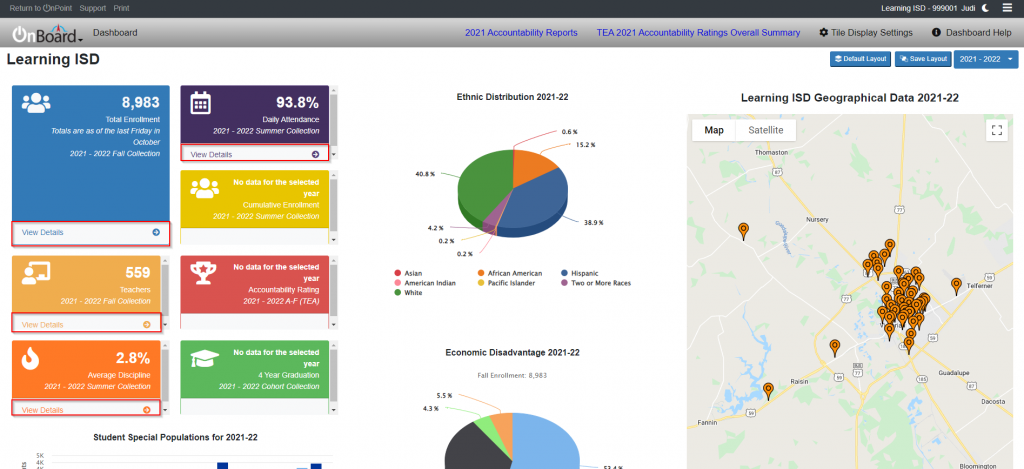
Total Enrollment
The total enrollment displayed here represents a “snapshot” of the total count on the last Friday in October for the selected school year. Your district submits data each fall to the TEA (Texas Education Agency).
Your district has until early December to submit final fall snapshot numbers, a re-submission period extends into January of the school year in case adjustments are needed.
Daily Attendance
After the final day of the school year your district submits cumulative data to the Texas Education Agency for the school year, this is called the summer collection. The summer collection contains totals for the year in many data categories. Your district may load “pre-liminary” summer files into OnBoard so the data may be viewed here, during the current year. The data you see here is as-of the last data set loaded by your district into OnBoard. Your district has until September to submit a final data set to the TEA.
The “Daily Attendance” percentage displayed is the average for each day as of the latest data load.
Teacher Retention Rate
The Percent displayed is based on total number of teachers who were reported in the prior year and returned in the following year. The teachers counts are from a snapshot” of the total on the last Friday in October for the selected school year. Your district submits data each fall to the TEA (Texas Education Agency).
The report may also be run using FTE (Full Time Equivalency) counts. Example, if a school has 30 total staff, 20 full time and 10 half time then the FTE count would equal 25.
Accountability Rating
The accountability rating is pulled directly from TEA.
https://rptsvr1.tea.texas.gov/perfreport/account/
Discipline
Average Discipline is the per cent of students who have received one or more discipline referral.
Total number of students who were referred to the office on one or more occasions divided by the total number of students served for the year.
Graduation Rate
Graduation Rate = Total number students in graduating class (Co-hort) / Total numbers of student in class graduating.
# Students = Total number students in graduating class (Co-hort)
# Graduated = Total numbers of student in class graduating.
Student graduation information is submitted in the school year following the students graduation. For example a typical school year may run from August to May, graduation data would be submitted in the Fall collection, the snapshot collection.
Cumulative Enrollment
Cumulative enrollment is the total number of students who were enrolled at least one day or more in your district. Some students enroll and withdraw during the school year for various reasons. If the student was enrolled at least one day or more they will be included in this count. Cumulative enrollment is often also referred to total students served by your district.
After the final day of the school year your district submits cumulative data to the Texas Education Agency for the school year, this is called the summer collection. The summer collection contains totals for the year in many data categories. Your district may load “pre-liminary” summer files into OnBoard so the data may be viewed here, during the current year. The current year data you see here is as-of the last data set loaded by your district into OnBoard. Your district has until September to submit a final data set to the TEA.
Ethnic Distribution Graph
The ethnic distribution displayed here represents a “snapshot” of the per centage of students identifying by each ethnicity. The Per centage reflects counts on the last Friday in October for the selected school year. Your district submits data each fall to the TEA (Texas Education Agency).
Your district has until early December to submit final fall snapshot numbers, a re-submission period extends into January of the school year in case adjustments are needed.
Student Special Populations
The student special population displayed here represents a “snapshot” of the student counts in each special population. The counts reflect the total as of the last Friday in October for the selected school year and the prior year. Your district submits the data each fall to the TEA (Texas Education Agency).
Your district has until early December to submit final fall snapshot numbers, a re-submission period extends into January of the school year in case adjustments are needed.
Economic Disadvantage
The economic disadvantage per cent displayed here represents a “snapshot” of the student counts and percentages for each economic disadvantaged category. The counts reflect the total as of the last Friday in October for the selected school year. Your district submits the data each fall to the TEA (Texas Education Agency).
Your district has until early December to submit final fall snapshot numbers, a re-submission period extends into January of the school year in case adjustments are needed.
District Map
The map displays the location of each campus in your district. The source of the data is the Texas Education Agency AskTED application. You district maintains the data by logging to the Ask Ted portal and keeping the data updated as needed. The addres class=”indent”s information supplied is then utilized by google services to display the map. When clicking on an individual campus you may or may not see an image of the campus, some images are not available from google. In some cases a default image may be used.
HB3 Board Goals
In the top menu bar an HB3 Board Goals Link will appear only after goals have been set in the OnPoint administrative section of your OnDataSuite account. Please visit the KB articles associated with how to set and publish these goals for more information.
https://kb.ondatasuite.com/article-tags/hb3-board-goal/