Report Revised 10-2025
This report represents the latest STAAR 110% report which has been revised from the current STAAR 110% report which has been set to legacy and will be discontinued after December 13, 2025 and removed from under the 110% folder.
This article will support all of the updates and changes that were made to the original legacy report.
Report updated 11/14/25: The base search for the 110% report now includes all students enrolled in PEIMS for both summer and fall of the most recent year, regardless of testing status, providing a more complete student count. The previous beta version only included students in the fall PEIMS submission who had tested, excluding students with summer-only enrollment and resulting in undercounted totals..
Report Location
The 110% Report and the 110% At-A-Glance reports reside under the Accountability section of OnDataSuite.
Initial student selection
Important note about report generation speeds
Because this report is processor-intensive, rendering times may vary based on the number of students and selected filters. To improve initial performance, the first run automatically limits results to the first available campus and students with a 110% status of “Not Met CY” or “Not Met@110.”
After the report loads, users may adjust filters as needed—however, selecting all options will significantly increase processing time.
Base search criteria used to find students pulled into this list
Any student that has a test result associated to the most recently tested Current Year (CY) testing cycle will be drawn into this report.
Students Current Year Attribution Display
Important note about campus level VS Districtwide review of these reports
The base search includes all tested results for the current year (CY). However, student results are displayed based on their last tested subject and campus, not their current-year campus assignment
If a user is assigned to a specific campus in the system they will only have access to view students that have tested on their campus at least one time. If a student has moved to a new campus (for example, from elementary to middle school), their results will not appear under the new campus until the student has completed and received scored results for that campus.
Users with district wide (all campus) access will have access to all students in the 110% report regardless of campus testing history.
Example:
Jane Doe last tested in 6th Grade Math at Barry Miller Elementary (PK–6) in Spring 2024. She will not appear under Alvin Bishop Middle (7–8) until she tests in 7th Grade Math in Spring 2025.
Testing records used in the calculation of 110%
Any in-district STAAR 3-8
Any in-district STAAR EOC
Any out-of-district Student Data Retrieval (SDR) STAAR or EOC will also be pulled in if the assessment can be associated back to a student.
(Requires PEIMS record on file to associate the record)
SDR file used in the CY derived from an SDR file will automatically highlight all row in yellow
Records Displayed
All CY tested students will be displayed regardless of if 110% is required or not. Users will have the option of filtering results to best suit their needs.
Associated record progression
Subject to Prior Year Subject
Each CY record is associated back to the Prior Year (PY) tested subject when available. It is not associated by subject/grade to account for accelerated testers in a given subject
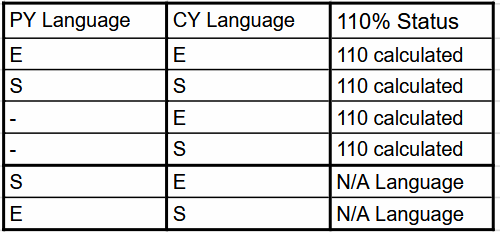
Language inclusion / exclusion
Each CY to PY record must be the same language or the system cannot calculate the 110% value. Items that can be calculated will run the 110% calculation as outlined in the chart below
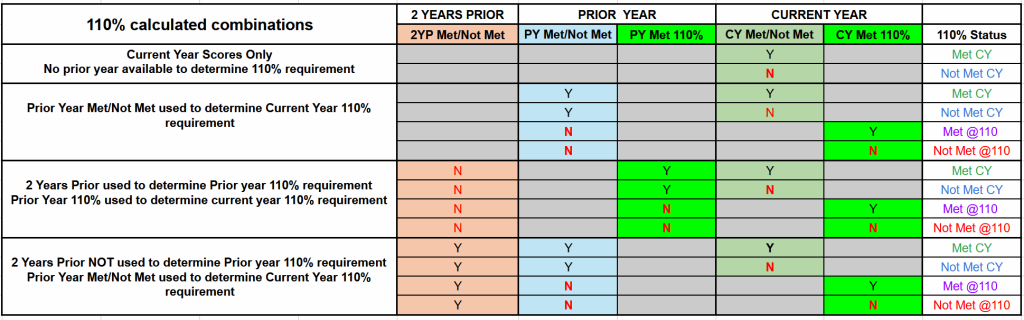
Calculated 110% Status results combinations used
Calculations support up to three concurrent years when data is available
This report calculates the Current Year (CY) values and, when data is available, can also regressively retrieve data from the Prior Year (PY) and Two Years Prior (2YP) to determine the 110% requirement.
110% Status results column displayed results explained
Results that do NOT require the use of the 110% calculated value will NOT include the label of ‘@110’ in the calculated result and will display as either of the two labels listed below
Met CY
Not Met CY
Results that DO require the use of the 110% calculated value will include the the label of ‘@110’ in the calculated result and will display as either of the two labels listed below
Met @110
Not Met @110
Results that cannot be calculated due to language
N/A Language
110% test association crosswalk
Clarifying details of each combination used can be reviewed in the 110% calculated combinations chart below
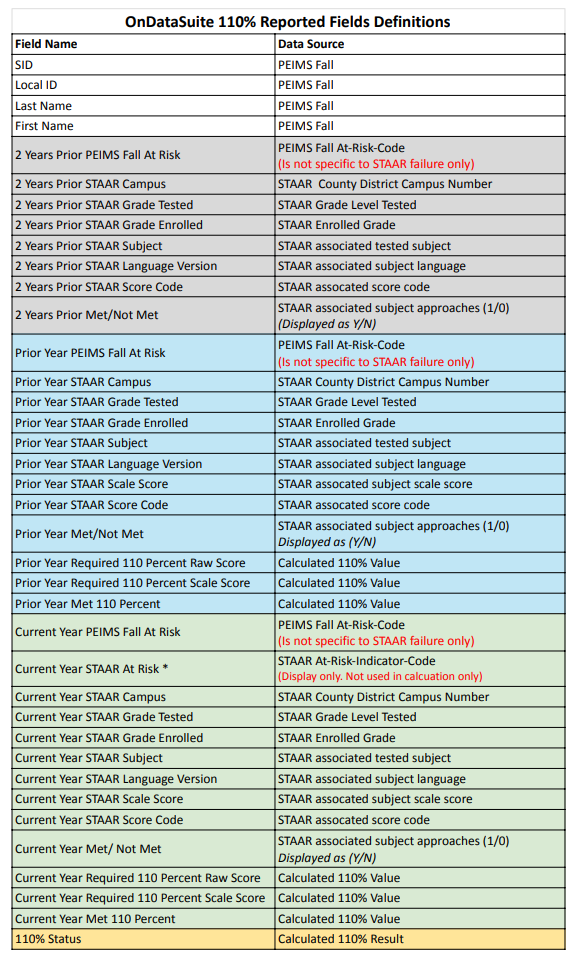
Reported Columns Data Sources
Each data element displayed in the 110% report is derived from one of the following sources: PEIMS records on file, uploaded STAAR/EOC data files, or calculated values based on data from either of these sources. The attached chart clarifies the source of data for each displayed column.
Important note: The Current Year STAAR At Risk * column displayed in this report is NOT USED in the calculation of this report. It is displayed only to show the coded ‘At Risk’ value reported in the assessment file. (TEA Data File Format: location 118 At-Risk-Indicator-Code)
STAAR 110% Report Assessment to Prior Year Assessment Crosswalk
The 110% Report first analyzes the Current Year (CY) tested subject and then regresses to the Prior Year (PY) exam in the same subject to establish a performance link. It subsequently looks back an additional year to the Prior Year 2 (PY2) exam to form another link.
Note: Links are established by subject across years, not by grade level. This intentional design ensures that students with testing gaps or those who test in accelerated grade levels are still accurately captured in the analysis.
The following OnDataSuite STAAR 110% Report – Prior-to-Current Year Association Crosswalk illustrates the process using a common, consecutive testing sequence. It does not include examples of students who tested outside the expected grade-level progression (e.g., accelerated or skipped-grade testers).
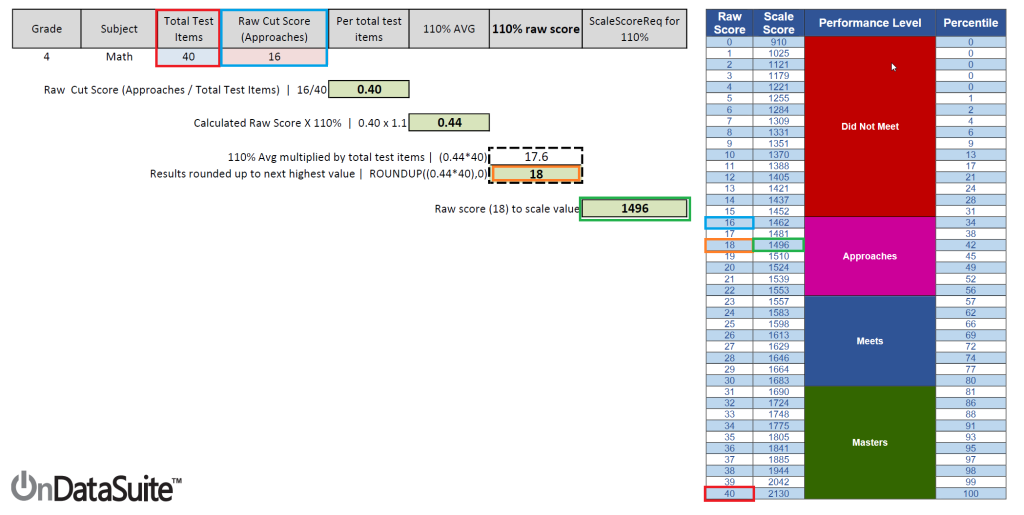
Explanation of how 110% value is calculated
The value of each 110% required score is derived from current year tested approaches level raw cut score being divided by the total test items
This value is then multiplied by 110% (1.1)
The returned value is then multiplied by the total test items and its value is rounded up to the next highest value to get the calculated 110% raw score
That raw score is then associated back to the current year test performance level scale score