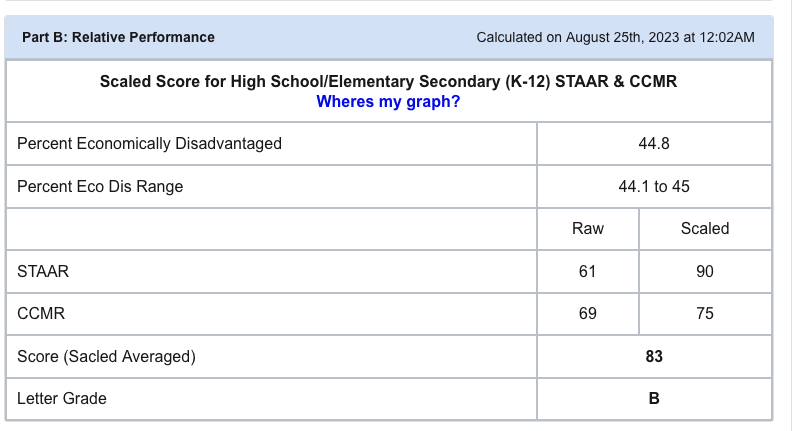
Are you looking for this graph?
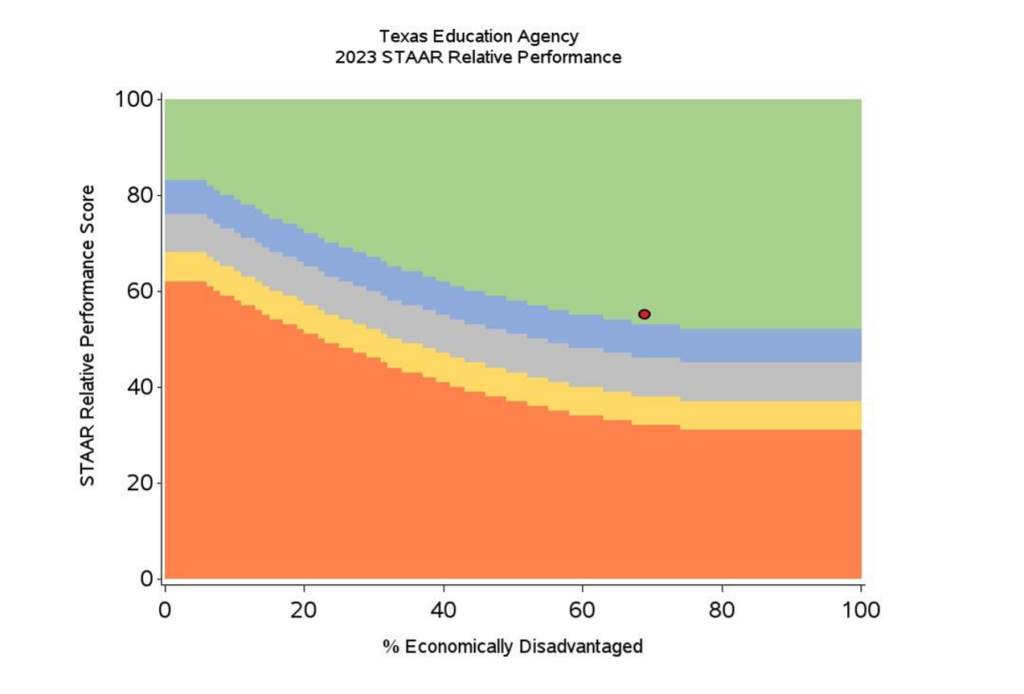
We have replaced the relative performance graph with a consolidated chart to show your Economically Disadvantaged, Percent Eco. Disadvantaged Range from the Accountability Manual (pg 60-63) and STAAR, CCMR when needed with an overall raw score and letter grade for Domain II Part B.