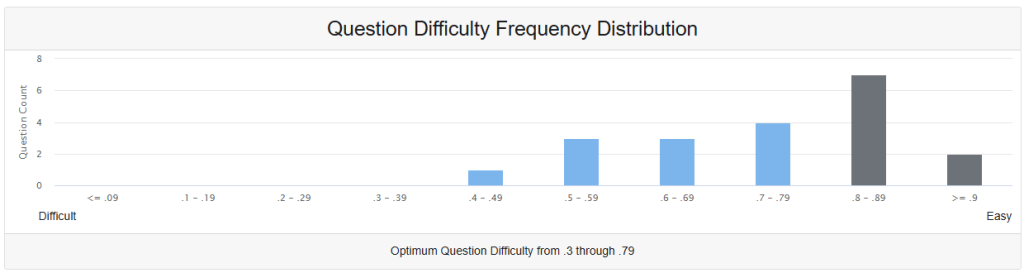
The Question Difficulty Distribution chart displays the frequency distribution of assessment items based on their P-Value (proportion correct), which serves as the primary metric for measuring item difficulty in classical test theory.
P-Value Definition and Formula
P-Value in educational assessment represents the proportion of examinees who answered a question correctly:
P-Value = Number of Correct Responses / Total Number of ResponsesWhere:
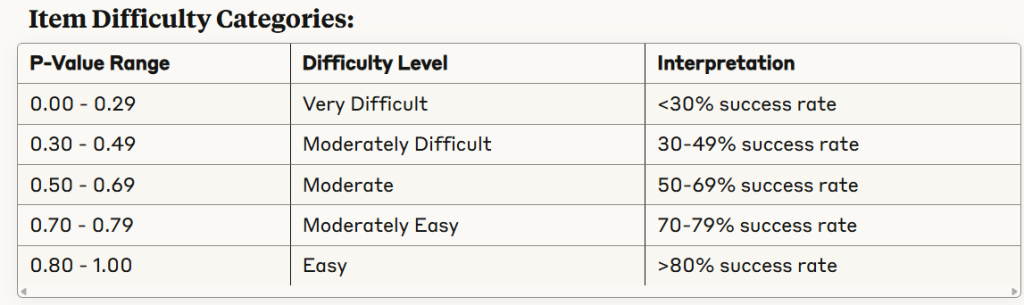
- P-Value ranges from 0.00 to 1.00
- Lower P-Values (0.00-0.29): Difficult items – few examinees answer correctly
- Moderate P-Values (0.30-0.79): Optimal discrimination range
- Higher P-Values (0.80-1.00): Easy items – most examinees answer correctly
Distribution Analysis
Current Distribution Characteristics:
- Difficult Items (≤0.09): 0 questions
- Moderately Difficult (0.1-0.19): 0 questions
- Low-Moderate (0.2-0.29): 0 questions
- Optimal Range (0.3-0.79): Majority of questions concentrated here
- Easy Items (≥0.8): 7 questions (highest frequency)
Optimal Difficulty Range (0.3-0.79)
The highlighted optimal range represents items that provide maximum discrimination between high and low-performing examinees. This range is preferred because:
Discrimination Formula:
Item Discrimination = P-Value × (1 - P-Value)Maximum discrimination occurs when P-Value ≈ 0.50, where the formula yields the highest value (0.25).
Statistical Interpretation
Distribution Quality Metrics:
Mean Difficulty Calculation:
Mean P-Value = Σ(Pi × fi) / ΣfiWhere Pi = P-value of item i, fi = frequency of items in range i
Standard Error of P-Value:
SE(P) = √[P(1-P)/N]Where N = number of examinees
Recommendations for OnTarget Implementation
Current Distribution Issues:
- High concentration in easy range (≥0.8): May reduce assessment discrimination
- No items in difficult ranges: Limits ability to identify high achievers
- Optimal range underutilized: Missing opportunity for maximum discrimination
Optimal Distribution Target:
- 10-15% in difficult range (0.2-0.4)
- 60-70% in optimal range (0.4-0.7)
- 15-25% in easy range (0.7-0.9)
- <5% in very easy range (>0.9)
Quality Assurance Formula:
Assessment Reliability ∝ Σ[Pi(1-Pi)]Interpretation: Higher reliability achieved when items cluster around P-Value = 0.50, maximizing the sum of discrimination indices across all items.
This distribution analysis enables OnTarget to optimize question banks for maximum assessment validity and reliability while ensuring appropriate challenge levels for target populations.