What is Item Analysis?
Item Analysis is a statistical method used to evaluate the effectiveness of individual test questions or assessment items. It provides two key metrics: item difficulty (measured by P-value) and item quality/discrimination (measured by Point Biserial Correlation). This analysis helps identify which questions are performing well and which may need revision or removal.
Item Difficulty (P-Value)
Definition
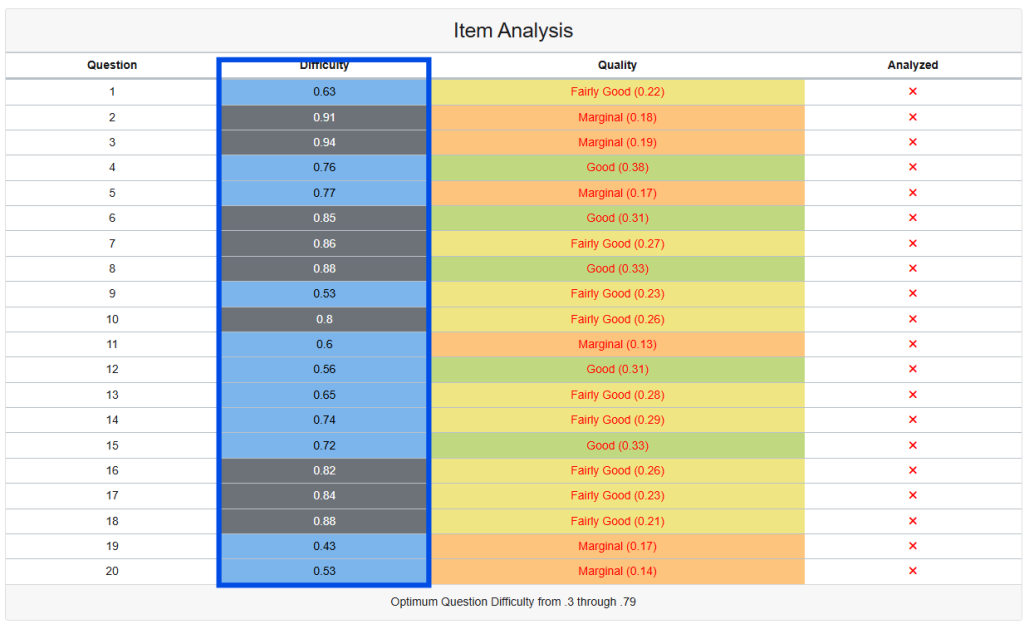
The P-value represents the proportion of test-takers who answered the item correctly. It ranges from 0.00 to 1.00, where higher values indicate easier items.
Formula
P-value = Number of correct responses / Total number of responsesInterpretation
- 0.00 – 0.30: Very difficult items
- 0.30 – 0.79: Optimal difficulty range (as noted in your screenshot)
- 0.80 – 1.00: Very easy items
Analysis of Your Data
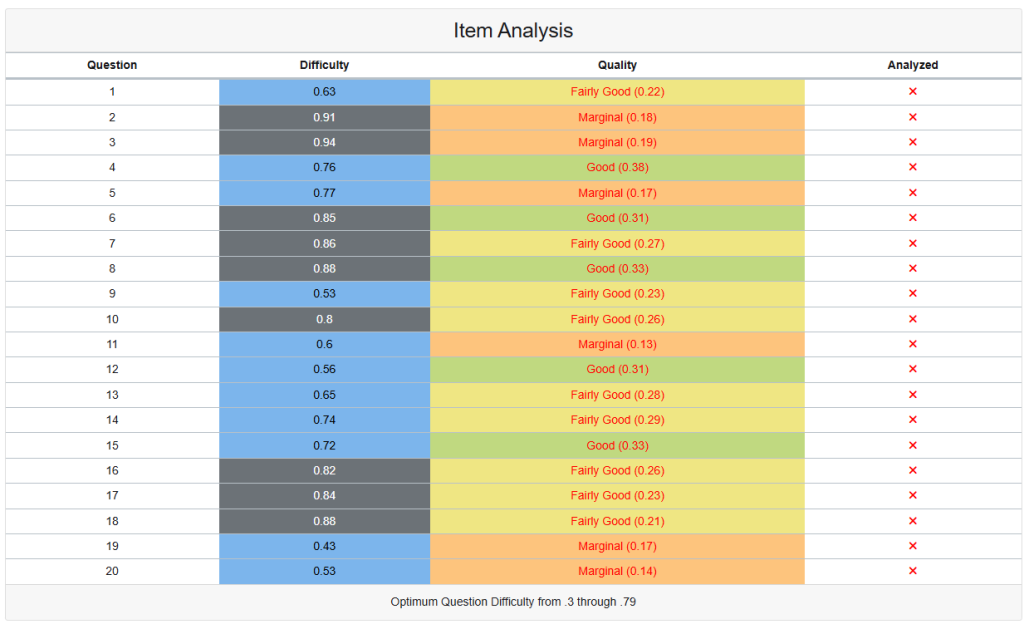
Looking at the screenshot:
- Questions 2, 3: Very difficult (P = 0.91, 0.94) – may be too easy
- Questions 6, 7, 8, 16, 17, 18: Moderately difficult (P = 0.80-0.88) – approaching upper limit
- Questions 1, 4, 5, 9, 10, 12, 13, 14, 15: Within or near optimal range
- Questions 19, 20: Good difficulty (P = 0.43, 0.53)
Item Quality (Point Biserial Correlation)
Definition
Point Biserial Correlation (rpb) measures how well an individual item discriminates between high-performing and low-performing test-takers. It indicates the relationship between performance on a specific item and overall test performance.
Formula
rpb = (Mp - Mq) / St × √(p × q)

Where:
- Mp = Mean total score of those who got the item correct
- Mq = Mean total score of those who got the item incorrect
- St = Standard deviation of total test scores
- p = Proportion who got item correct (P-value)
- q = Proportion who got item incorrect (1 - p)
Interpretation Guidelines
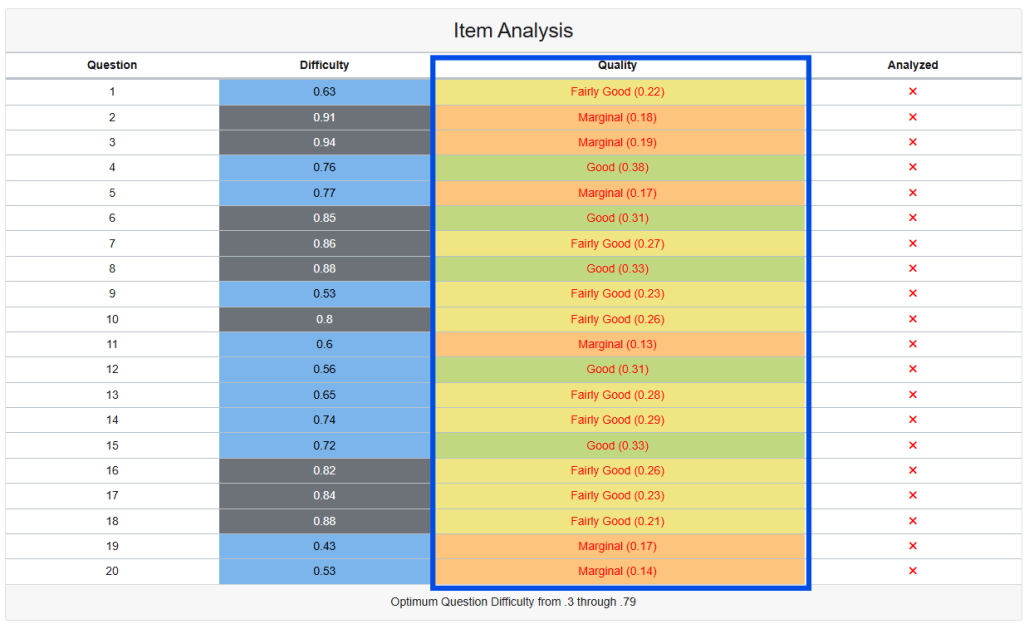
- ≥ 0.30: Good discrimination (Green in your interface)
- 0.20 – 0.29: Fairly good discrimination (Yellow in your interface)
- 0.10 – 0.19: Marginal discrimination (Orange in your interface)
- < 0.10: Poor discrimination (Red – should be reviewed/removed)
Analysis of Your Data
Based on the color coding and values shown:
Good Items (Green – rpb ≥ 0.30):
- Questions 4, 6, 8, 12, 15 show strong discrimination
Fairly Good Items (Yellow – rpb 0.20-0.29):
- Questions 1, 7, 9, 10, 13, 14, 16, 17, 18 show acceptable discrimination
Marginal Items (Orange – rpb 0.10-0.19):
- Questions 2, 3, 5, 11, 19, 20 show weak discrimination and should be reviewed
Technical Recommendations
Items Requiring Attention
- Questions 2 & 3: Very high difficulty (P = 0.91, 0.94) with marginal discrimination
- These items are too easy and don’t effectively differentiate between ability levels
- Consider adding distractors or increasing complexity
- Question 11: Moderate difficulty but poor discrimination (0.13)
- May have flawed distractors or ambiguous wording
- Review for clarity and option effectiveness
- Questions 19 & 20: Good difficulty but marginal discrimination
- Content may not align well with overall assessment objectives
- Consider revising to improve discrimination
Optimal Items
Questions 4, 6, 8, 12, and 15 demonstrate the ideal combination of appropriate difficulty and strong discrimination, making them highly effective assessment items.
Statistical Considerations
Sample Size Requirements
Point Biserial Correlation requires adequate sample sizes (typically n ≥ 30) for reliable estimates. Smaller samples may produce unstable correlation values.
Relationship Between Difficulty and Discrimination
Items with extreme P-values (very easy or very difficult) mathematically cannot achieve high discrimination values due to restricted variance. The optimal difficulty range of 0.30-0.79 maximizes the potential for good discrimination.
Quality Thresholds
The color-coded quality categories in your interface provide actionable guidance:
- Green: Retain as-is
- Yellow: Monitor performance
- Orange: Review and consider revision
- Red: Strong candidate for removal or major revision
This item analysis provides data-driven insights for improving assessment quality and ensuring that each question contributes meaningfully to measuring the intended construct.
Practical Steps for Improvement
Before Your Next Test:
- Review marginal questions (orange): Look for unclear wording, confusing grammar, or unrealistic answer choices
- Examine very easy questions: Consider whether they’re testing important concepts or just recall of simple facts
- Check alignment: Ensure questions match your learning objectives and instruction
During Test Review:
- Pay special attention to questions with poor discrimination when going over answers with students
- Ask students what made certain questions confusing or tricky
- Note patterns in incorrect answers to improve future versions
For Future Assessments:
- Keep your green questions – they’re working well
- Revise yellow questions – small improvements can make them more effective
- Seriously consider replacing orange questions – they may not be serving their purpose
Why This Matters
Good test questions do more than just assign grades – they:
- Help you accurately identify which students need additional support
- Provide reliable feedback about your instruction
- Build student confidence by being fair and clear
- Save you time by reducing disputes about “tricky” questions
Remember, even experienced educators regularly review and improve their assessment items. This analysis gives you objective data to make your tests more effective tools for both teaching and learning.