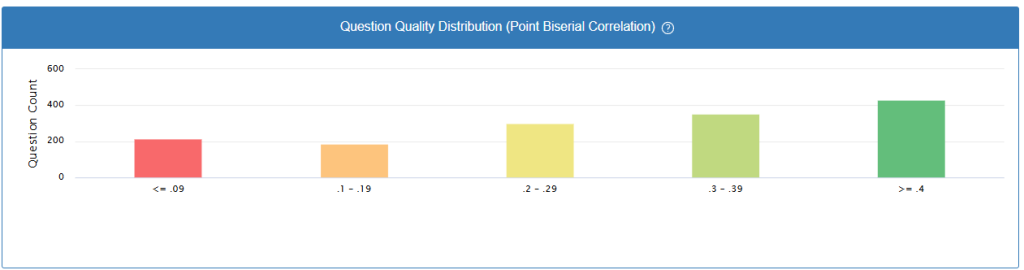
Color-Coded Quality Levels:
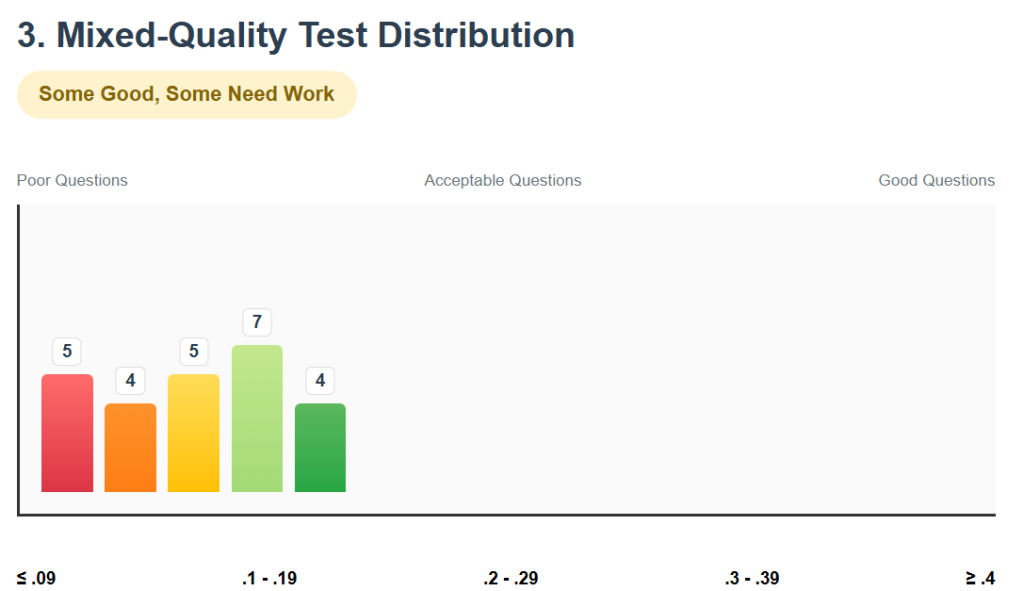
- Red (≤ .09): Very poor questions – these may actually hurt your assessment
- Orange (.1 – .19): Poor questions – not effectively measuring student understanding
- Yellow (.2 – .29): Acceptable questions – doing an okay job but could be improved
- Light Green (.3 – .39): Good questions – effectively separating high and low performers
- Dark Green (≥ .4): Excellent questions – very strong at measuring student understanding
What These Patterns Tell You:
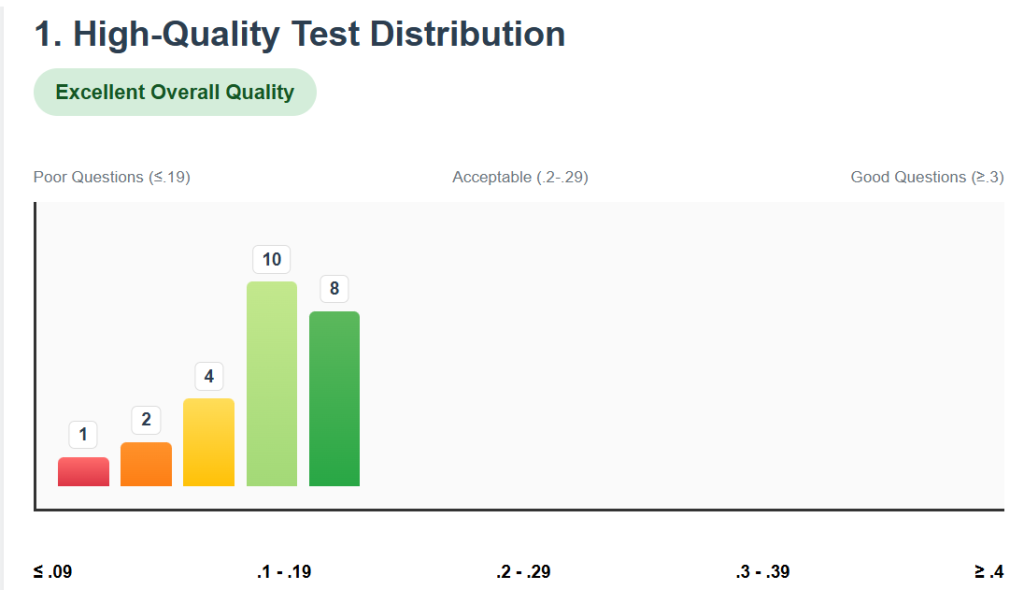
- High-Quality Distribution: Your test is working well! Most questions effectively separate students who understand from those who don’t. Keep using this assessment format.
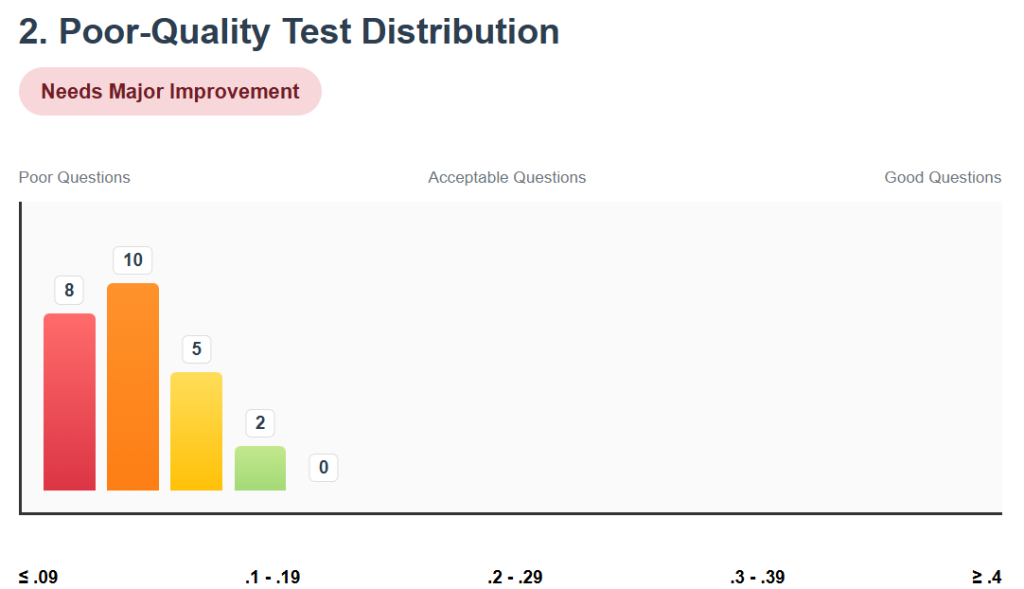
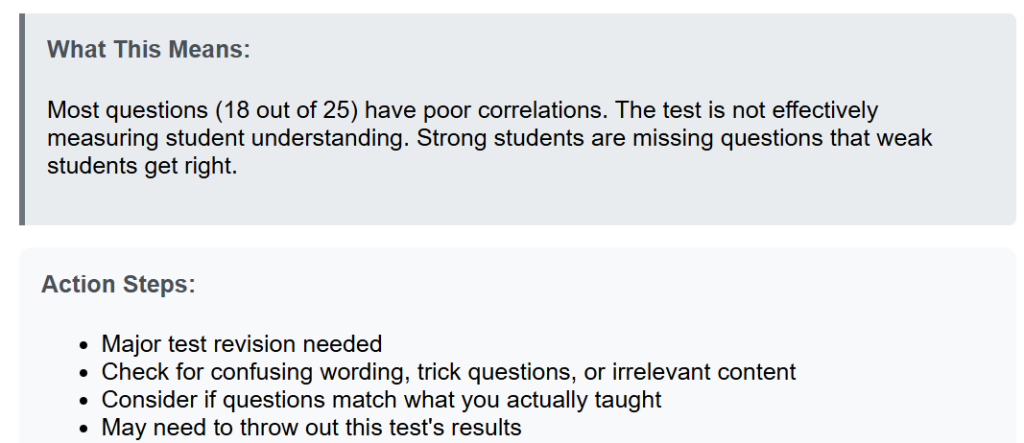
- Poor-Quality Distribution: Major problems with your test. Questions might be confusing, cover material you didn’t teach, or have other issues. Consider revising heavily or starting over.
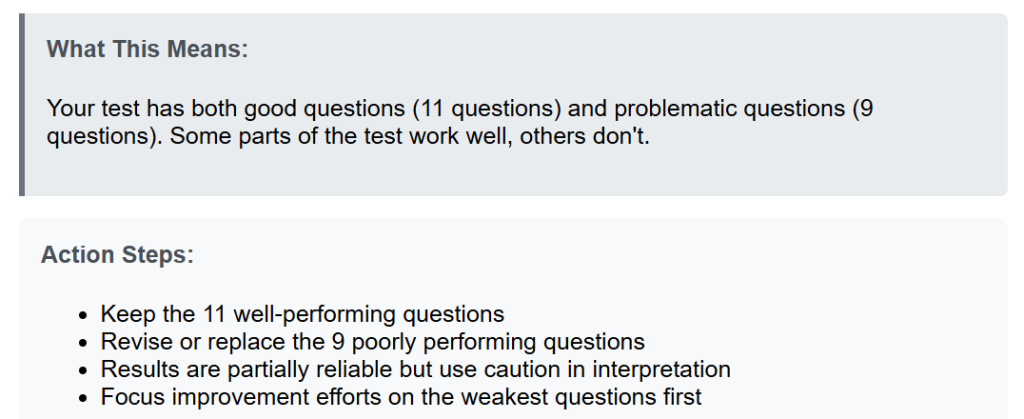
- Mixed-Quality Distribution: Some questions work great, others don’t. Focus your revision efforts on the poorly performing questions while keeping the good ones.
- Flat Distribution: Your test lacks consistency. This might happen when questions cover too many different skills or the format doesn’t match the content.
Practical Application:
When you get assessment results back (especially from district or standardized tests), look for these patterns in the point biserial correlations:
- Individual questions with low correlations need revision
- Overall distribution patterns tell you about test quality
- Your goal: Most questions should fall in the 0.3-0.7 range
Key Insights from These Breakpoints:
- Anything below 0.2 (red and orange bars) indicates problematic questions that need revision or removal
- Questions at 0.2-0.29 (yellow) are marginally acceptable but represent opportunities for improvement
- Questions at 0.3 and above (green bars) are doing their job well and should be kept
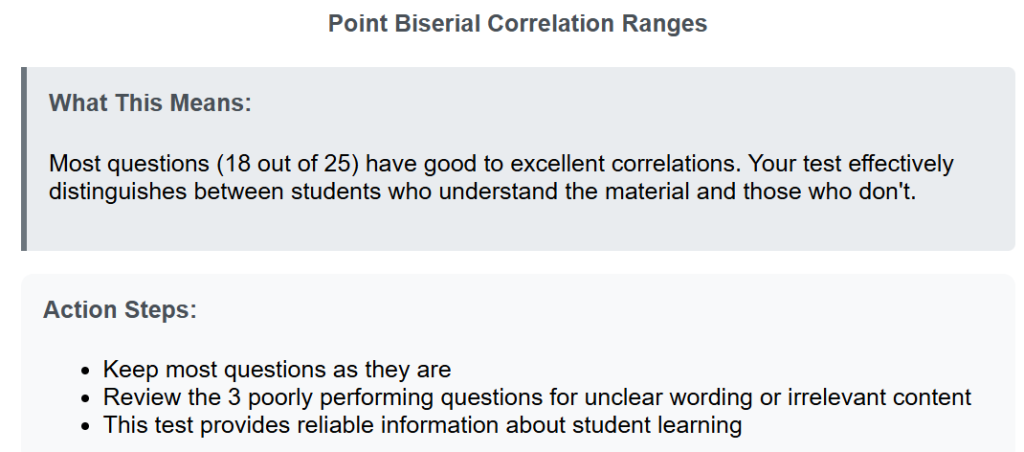
Quick Rule of Thumb: If more than 20% of your questions have correlations below 0.2, your entire test needs significant improvement. This means too many questions aren’t doing their job of measuring student understanding effectively.
This analysis helps you build better assessments over time and interpret your current results more accurately!