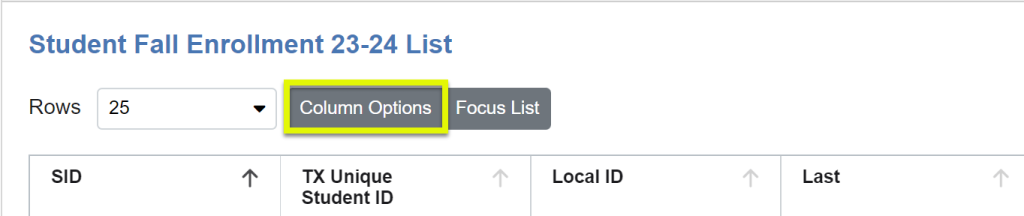
Column Options allows editing and adding information to a detailed student or staff list report from different data sources and/or different years, and various submissions. (Located above column titles.)
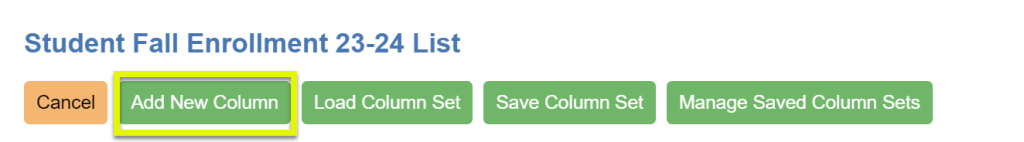
Add New Column
Use to add a column(s) of data to the list. Format follows Report Center categories/columns.
Example image: Adding STAAR 3-8 columns
1. Select a “Data Set”
Selects the data table from your file center you will be pulling data from
Note about state assessment files: Data sets for state assessment files are separated by district files (Students tested in District) and SIRS/SDR files (Students tested out of District) The default selection is set to “District (no SIRS/SDR) files”. If you wish to include SDR data in our column option you will need to specify using the SIRS/SDR dropdown.
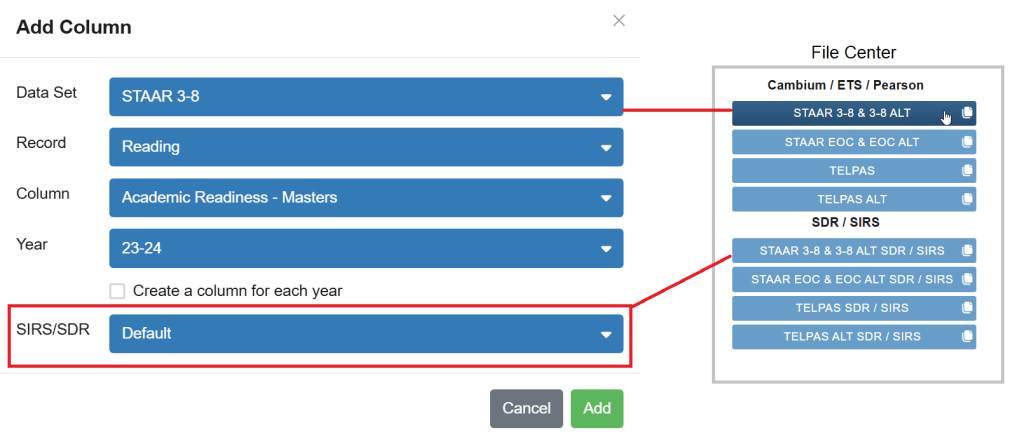
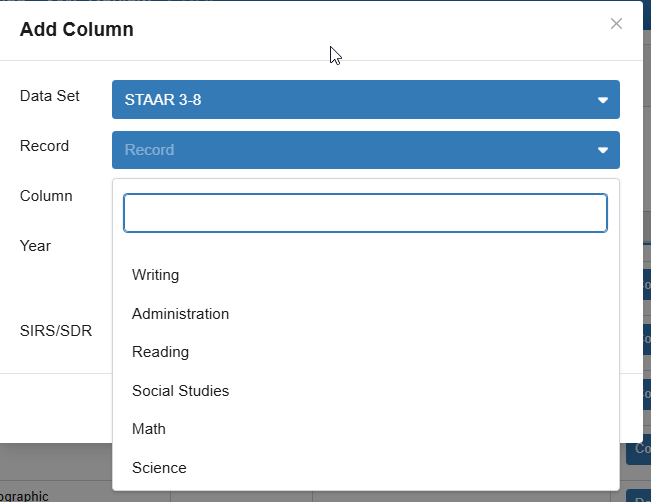
2. Select a “Record”
Each data set will have a related ‘record’ tables available. Select the table that will contain the data fields you will be adding in the next step.
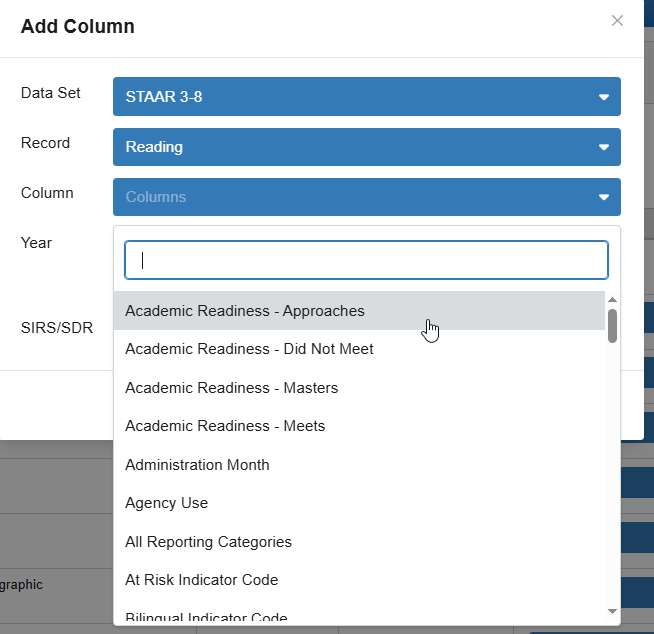
3. Select a “Column”
Select the fields available under the record you selected. You may select multiple columns from this option.
Note: Click outside of dropdown list to return to the Add Columns box in the background
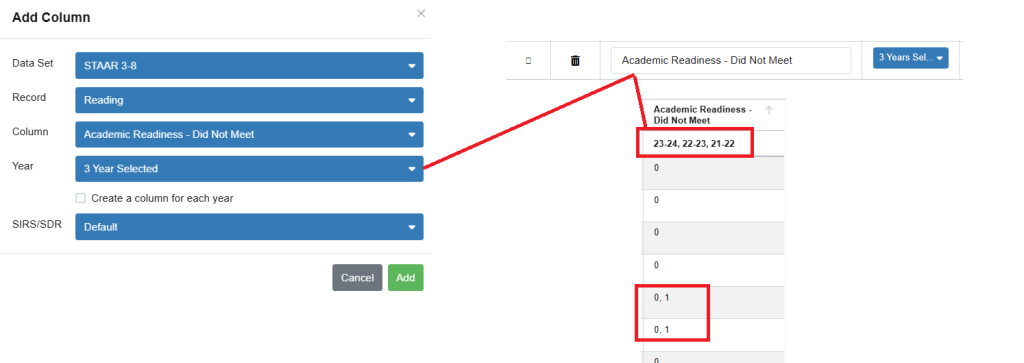
4. Select a “Year” – may select multiple
Select the year(s) you would like your data columns to display.
Note: If more than one year is selected, the default is to put every year’s value inside a single column which will show as a comma separated value
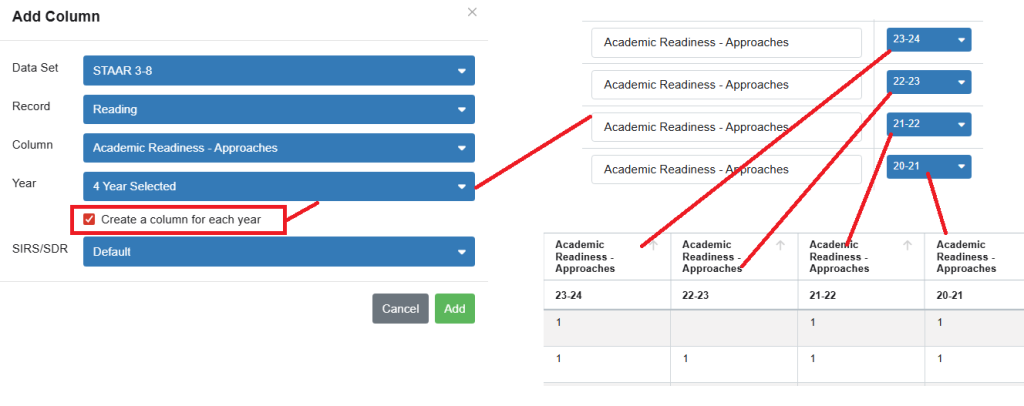
Create a column for each year option
When selecting multiple years there is a checkbox option to ‘create a column for each year’. This will create a column for each year to separate the years into multiple columns
5. Click the Add button
After you click the ‘Add’ button, it will place the new data columns at the bottom of the current display.
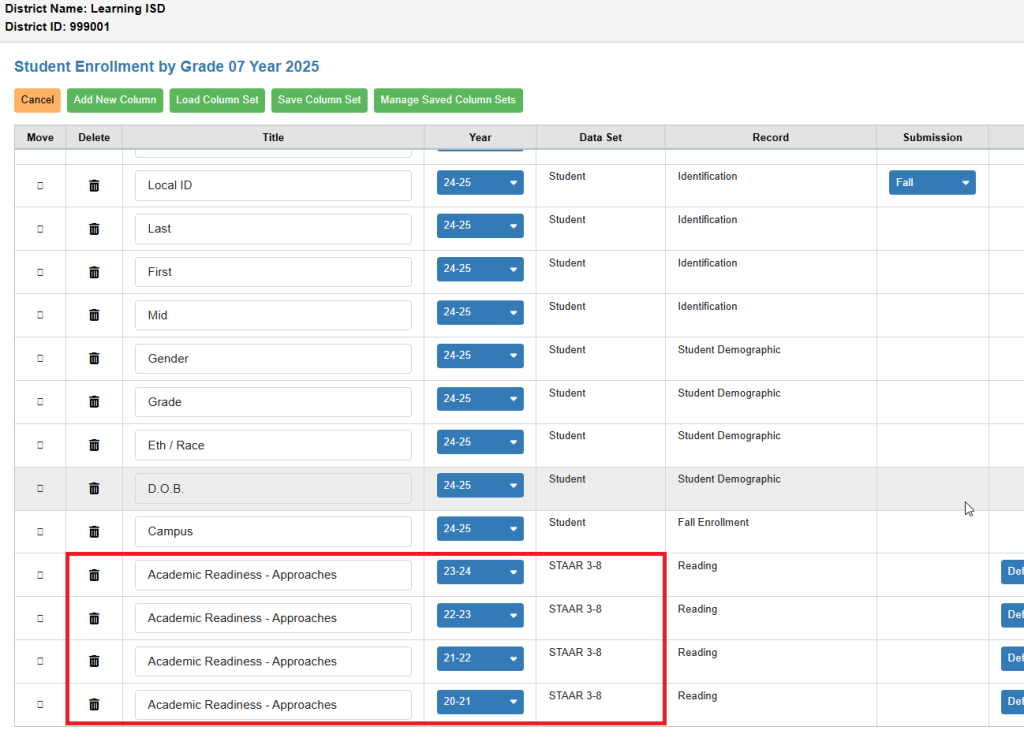
6. Review your columns at the bottom of your list then click the submit button at the top of the page.
Review your added columns, make changes to header titles, arrange them in the order you would like them to be displayed and then click the ‘Submit Changes’ button at the top right-hand side of the page to generate the changes to your report.
Add more columns from other sources, records, or years by repeating above steps.
Click Submit Changes, top right-hand side, to generate the report.
Save Column Set
Use the Save Column Set tab when you want to “store” 1 or more of the rows of data to be used for future reports.
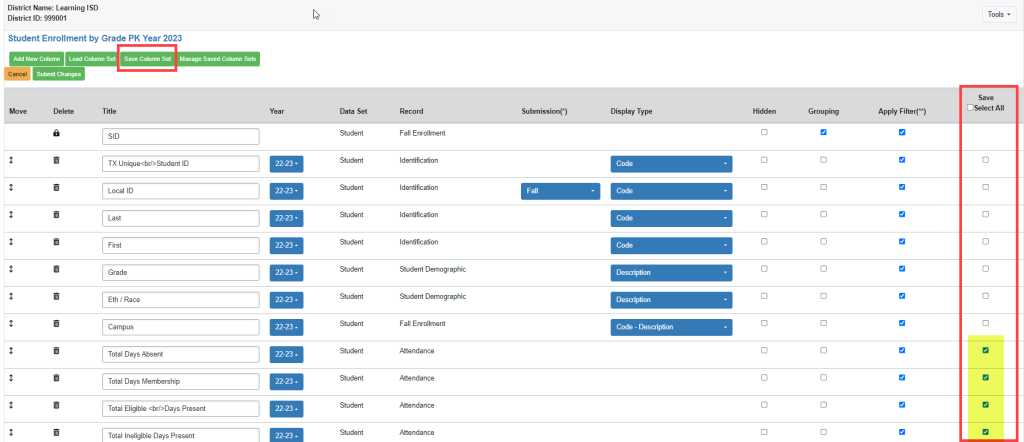
- First, select the row(s) of data to be saved by checking the box in the “Save” column. NOTE: option to “Select All”.
- Next click the “Save Column Set” tab.
- Provide a name, or use the default for this set of data.
Save Years – to retain the year for which that data is being pulled. It is listed on the row selected to be saved.
Save Code Display type – to retain the type of display selected for the row being saved. (Code, Description, or Code and Description)
Load Column Set – to add the “Saved Column Set” to the report.
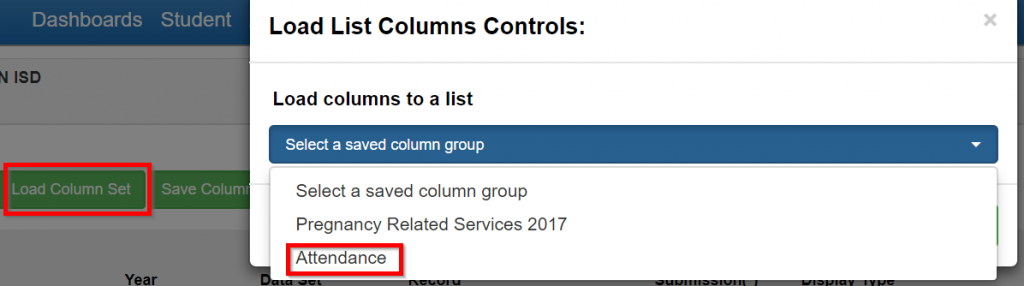
- Select Load Data Set
- Select the title of the set of columns, previously saved, to be added to the report.
- Click “Load”.
- All of the rows of data saved in this set will be added to the bottom of the display.
- Click “Submit Changes” to view report with added columns.
Manage Saved Column Sets

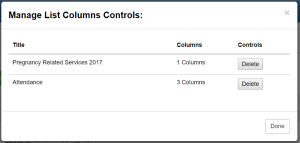
View or Delete current saved rows of data.
To EDIT columns/rows on the report
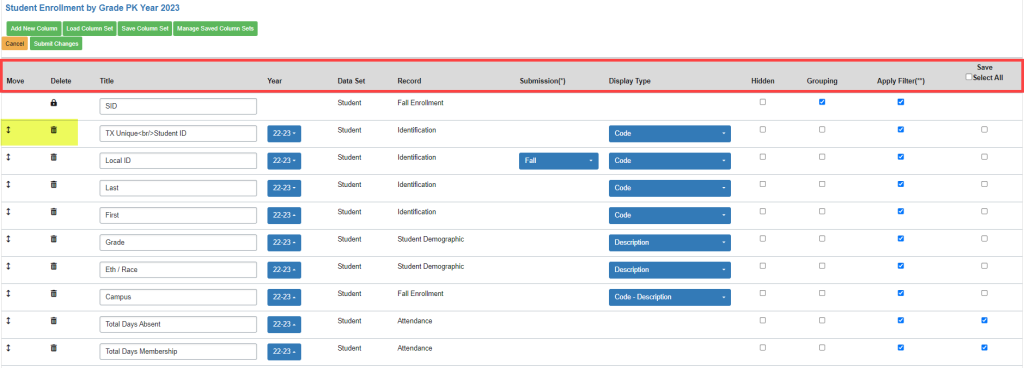
- Move the rows by using the blue up/down arrows to reorder the columns on the report display.
- To Delete a column of data, click the trash can icon.
- Relabel the Title of a row instead of using the default Title. It is a free form field.
- Use the drop down to select a different Year for the data.
- Data Set– Lists which file the data is pulling from
- Record – Describes which record/area the data is pulling from
- Submission – Identifies which PEIMS submission the data is pulling from
- Example: Economic Disadvantage is reported in both Fall and Summer PEIMS. User can expect to see identification as to which submission is being pulled to display the data.
- Change the Display Type to “Description” or the PEIMS “Code” or both
- Select a row of data to be Hidden when the report displays
- Grouping allows the user to group/ungroup data to be displayed
- Apply Filter allows the user to deselect the original filter applied to columns that have been added to the report. EXAMPLE:
- Report originally created to look for fall eco dis students coded 01-Free for 18-19
- After adding fall eco dis code for 17-18 using Add New Column described earlier, if check mark left on (filter applied), report will apply the 18-19 fall eco dis filter of 01 to the 17-18 fall eco dis code and will only return students who are fall eco dis 01 in BOTH 18-19 and 17-18
- Remove check (filter not applied) on the 17-18 eco dis column and the report will return all students coded fall eco dis 01 in 18-19 along with the fall eco dis reported in 17-18 regardless of what the code was that year
- Note: The students and the year in the original detailed student list cannot be changed
- Save – see section above