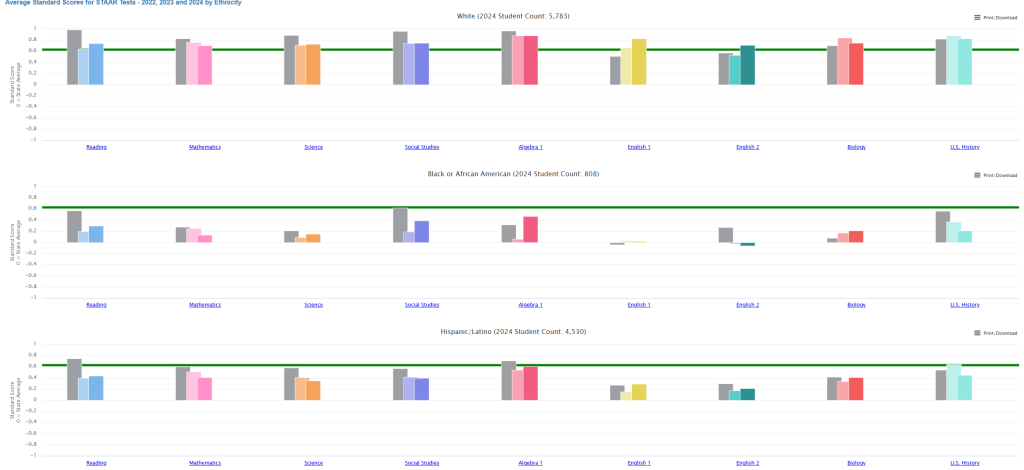
The STAAR Average Standard Scores by Ethnicity report displays standardized z-scores across multiple subject areas and demographic groups for the years 2022-2024. This standardization allows for meaningful comparisons across different test administrations, subject areas, and student populations.
Standardized Z-Score Methodology
Formula and Calculation
The standardized scores shown in this report are calculated using the standard z-score formula:
z = (X – μ) / σ
Where:
- z = standardized score (displayed on y-axis)
- X = raw scale score for the individual or group
- μ = population mean scale score
- σ = population standard deviation of scale scores
Score Interpretation
- z = 0: Performance at the population mean (indicated by the green horizontal reference line)
- z > 0: Performance above the population mean
- z < 0: Performance below the population mean
- ±1 standard deviation: Encompasses approximately 68% of the population
- Score range: Typically bounded between -3.0 and +3.0 standard deviations
Technical Specifications
Data Sources
The standardized scores are derived from TEA’s official STAAR scale scores, with calculations following methodologies outlined in the TEA Technical Digest Volume IV: Psychometric Report. The reliability coefficients and measurement precision statistics referenced in TEA’s Internal Consistency Report ensure the stability of these standardized comparisons.
Population Parameters
- Reference Population: All Texas students taking STAAR assessments in the respective test year
- Standardization: Performed annually to account for potential changes in overall performance distributions
- Missing Data: Students with “No Information Provided” ethnicity classifications are included as a separate analytical category
Subject Area Coverage
The report encompasses the following STAAR assessments:
- Elementary/Middle School: Reading, Mathematics, Science, Social Studies
- High School End-of-Course: Algebra I, English I, English II, Biology, U.S. History
Demographic Analysis Structure
Sample Sizes (2024 Data)
- White: 5,783 students
- Hispanic/Latino: 4,530 students
- Asian: 1,168 students
- Black or African American: 808 students
- Two or More Races: 548 students
- American Indian or Alaska Native: 24 students
- Native Hawaiian or Other Pacific Islander: 4 students
- No Information Provided: 15 students
Statistical Considerations
- Small Sample Adjustment: Groups with fewer than 25 students may show increased variability in standardized scores
- Confidence Intervals: Not displayed but should be considered when interpreting differences between groups
- Practical Significance: Differences of ±0.2 standard deviations generally represent educationally meaningful gaps
Quality Assurance
The standardization process adheres to TEA’s psychometric standards for:
- Internal Consistency: Cronbach’s alpha coefficients meeting minimum thresholds
- Standard Error of Measurement: Maintained within acceptable ranges across all demographic groups
- Scaling Accuracy: Annual verification against established benchmarks
This technical framework ensures that the displayed standardized scores provide reliable, valid comparisons of academic performance across ethnic groups while maintaining consistency with TEA’s official reporting standards.
Example
White Students (2024 Count: 5,783)
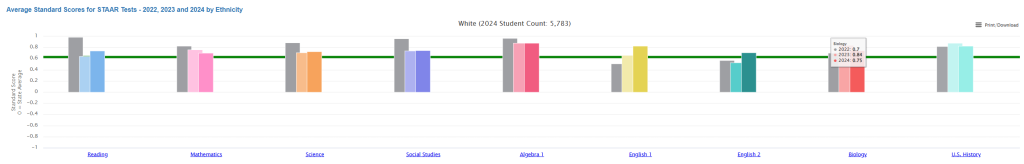
Performance relative to STATE mean (zero line):
- Performs significantly above the state mean across all subject areas
- Standardized scores range from approximately +0.4 to +0.8 standard deviations above state average
- Strongest performance in Mathematics (+0.7), Science (+0.7), and high school End-of-Course exams
Performance relative to DISTRICT mean (green line at ~+0.6):
This group appears to be driving much of the district’s overall high performance
Performs at or above the district mean in most subject areas
Exceeds district performance in Mathematics, Science, Algebra I, English I, Biology, and U.S. History
Slightly below district mean in Reading and Social Studies
Black or African American (2024 Count: 808)
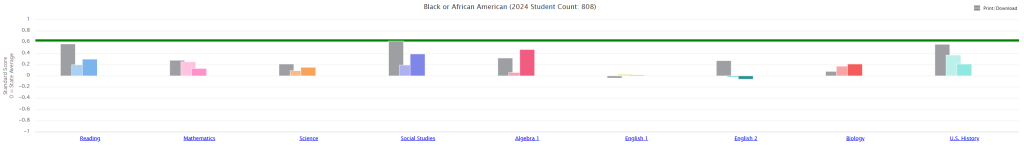
Performance relative to STATE mean (zero line):
- This group performs above the state mean in most subject areas
- Standardized scores range from approximately +0.1 to +0.4 standard deviations above the state average
- They show positive performance in Reading (+0.2 to +0.3), Mathematics (+0.2), Science (+0.1 to +0.2), Social Studies (+0.3 to +0.4), and Algebra I (+0.4)
Performance relative to DISTRICT mean (green line at ~+0.6):
- However, they perform below the district mean across all subject areas
- This indicates that while these students outperform the state average, there’s still a significant gap between their performance and the overall district performance
- The gap between their performance and the district mean ranges from approximately 0.2 to 0.4 standard deviations
This reveals that this is a high-performing district overall (district mean significantly above state mean), and while Black or African American students are achieving above state-level performance, there remains an achievement gap within the district that needs attention.
Hispanic/Latino Students (2024 Count: 4,530)
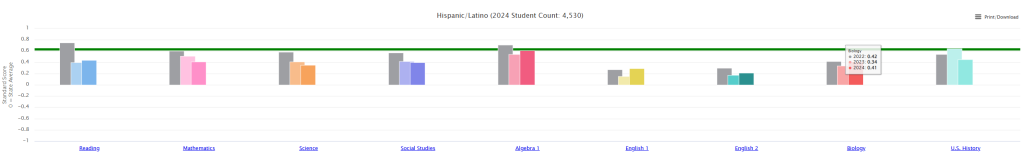
Performance relative to STATE mean (zero line):
- Performs above the state mean across all subject areas
- Standardized scores range from approximately +0.1 to +0.6 standard deviations above state average
- Particularly strong in Algebra I (+0.6) and Biology (+0.4)
Performance relative to DISTRICT mean (green line at ~+0.6):
- Performs below the district mean in most subject areas
- Gap ranges from approximately 0.1 to 0.4 standard deviations below district performance
- Closest to district mean in Algebra I and Biology
- Largest gaps in Reading, Mathematics, and Science
Two or More Races Students (2024 Count: 548)
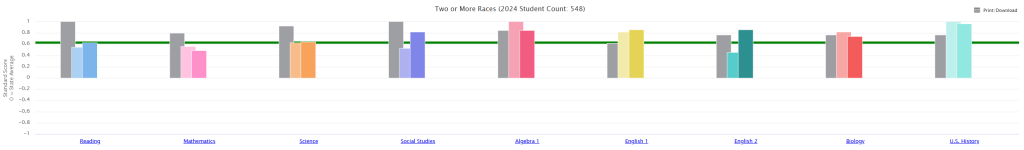
Performance relative to STATE mean (zero line):
- Performs significantly above the state mean across all subject areas
- Standardized scores range from approximately +0.4 to +0.8 standard deviations above state average
- Performance pattern very similar to White students
Performance relative to DISTRICT mean (green line at ~+0.6):
- Performs at or above the district mean in most subject areas
- Exceeds district performance in several high school End-of-Course exams
- Performance roughly equivalent to or slightly above the district mean across most subjects
- This group, like White students, contributes significantly to the district’s overall high performance
Key District-Level Insights:
- High-Performing District: The district mean is approximately 0.6 standard deviations above the state mean, indicating exceptional overall performance.
- All Groups Above State: Every demographic group performs above the state mean, which is remarkable.
- Within-District Achievement Gaps: While all groups exceed state performance, significant gaps exist within the district between demographic groups.
- Performance Hierarchy: White students and Two or More Races students perform at or above district mean, while Hispanic/Latino and Black or African American students, though above state mean, perform below the district mean.
This reveals a district with strong overall academic achievement but persistent equity challenges that need targeted intervention.