Report Location: Student>Student Custom Reports>Graduation / Dropouts / Cohorts
Summary: Report pulls students according to several different factors:
- Absentee Rate % greater than or equal to 10% for any reporting period or semester or YTD cumulative (can be changed)
- OR
- # Discipline Incidents greater than or equal to 3 for any reporting period or semester or YTD (can be changed)
- OR
- Failed Classes greater than or equal to 5 classes over the course of the year
- OR
- Shows Prior Year STAAR Performance Level – can export to CSV and filter by different STAAR criteria
Usage: Locate students who have the potential to be dropouts and identify causes to find solutions.
Special Notes:
- Filters can be manipulated to focus on one particular area. For example, to focus on # Discipline Incidents, make the Absentee Rate % = 100.1 (no student will match this) and the Failed Classes = 100 (no student will match this). To focus on Absentee Rate %, make the # Discipline Incidents = 100 and # Failed Classes = 100, and so on.
- Red shading appears only on the display when a value meets the filter threshold
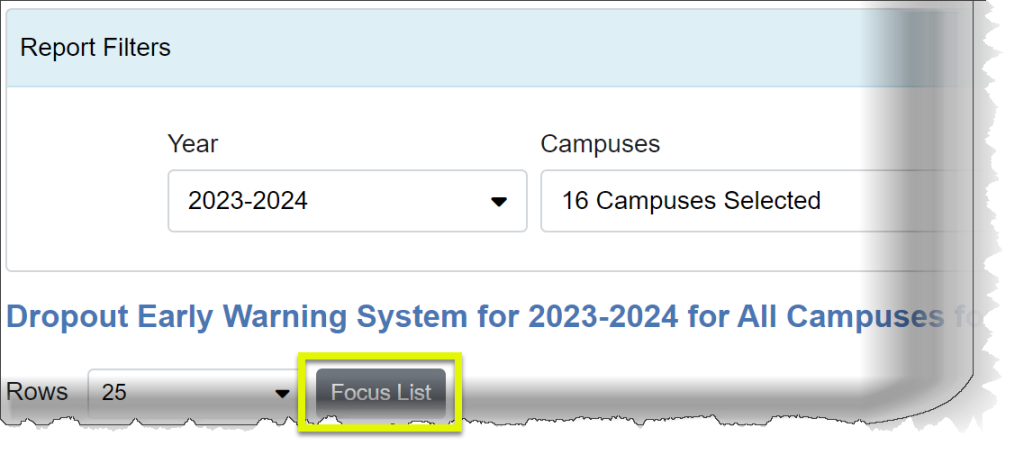
- Report allows you to create the displayed student list as a Focus List to run through other queries and reports

Data Source: Summer PEIMS
- 40100 Student Basic Information Sub-Category
StudentExtension Complex Type - 42400 Basic Attendance Sub-Category
BasicReportingPeriodAttendanceExtension Complex Type - 44425 Disciplinary Action Sub-Category
StudentDisciplineIncidentAssociationExtension Complex Type - 43415 Course Completion Sub-Category
CourseTranscriptExtension Complex Type - STAAR 3-8 and EOC data files
Features:
- Filters:
- Single select Year (Default most recent summer PEIMS year)
- Multi select Campuses with Search feature and School Levels (Default all campuses)
- Multi select Grades (Default all grades)
- Absentee Rate % defaulted to 10%
- # Discipline Incidents defaulted to 3
- # Failed Classes defaulted to 5
- Focus List to select a specific group of students
Special Note
EOC retester data may not show up as it is looking at prior year data
