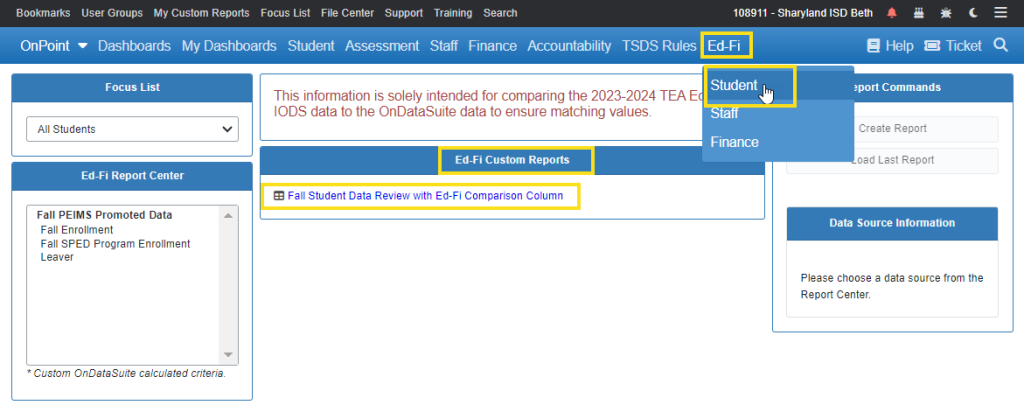
Report Location: Ed-Fi > Student > Ed-Fi Custom Reports
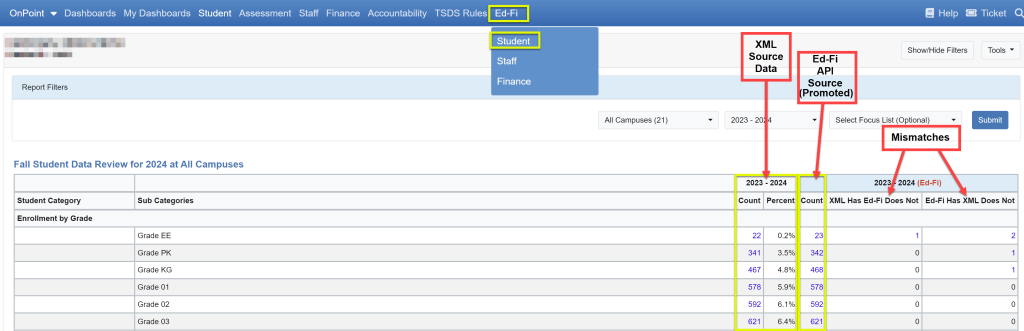
Summary: This report displays student counts and percentages as of the October snapshot date from the 23-24 Fall PEIMS (XML) submission and compares them to a count based on the OnDataSuite Data Mart which is derived from the TEA Ed-Fi IODS data with promotion logic applied.
Usage: Review student groups by counts comparing the data from your XML file for the Fall snapshot to the data migrated from your TEA Ed-Fi IODS that has been stored in the OnDataSuite Data Mart (promotion applied). Two additional columns to identify records ODS Has and TEA Does Not and records TEA Has and ODS Does Not are provided for reconciling mismatches between the OnDataSuite XML files and the OnDataSuite Data Mart promoted data.
Special Note:
- Associate Degree on this report is only for fall snapshot students.
Data Sources: Fall PEIMS
- 40100 Student Basic Information Sub-Category
StudentExtension Complex Type - 40110 Enrollment Sub-Category
StudentProgramExtension Complex Type - 41163 Special Education Program Sub-Category
StudentSpecialEdProgramAssociationExtension Complex Type - 41461 Title I, Part A Program Sub-Category
StudentTitleIPartAProgramAssociationExtension Complex Type
Definitions:
- Counts are based on students at snapshot per XML files.
- Ed-Fi Counts are based on students promoted to the OnDataSuite Data Mart.
- 2023-2024 (Ed-Fi)
- XML Has Ed-Fi Does Not : Students and codes that are in the ODS XML files but are not in the OnDataSuite Data Mart (promoted) derived from the TEA Ed-Fi IODS landing zone (static).
- Ed-Fi Has XML Does Not : Students and codes that are in the OnDataSuite Data Mart (promoted) derived from the TEA Ed-Fi IODS landing zone (static) but are not in the ODS XML files.
- Drill down to detailed student list to investigate Student’s Profile for mismatched data.
- Membership is the number of students who are receiving instruction at least 2 hours a day as reflected by their ADA eligibility code in Fall PEIMS (excludes ADA eligibility code 0 students)
Calculations:
- Percentages
- All Percentages are rounded to the nearest tenth
- Enrollment by Grade Percentages = Total in grade level / Total Enrollment
- ADA Code Percentages = Total by ADA Code / Total Enrollment
- Membership (ADA Eligibility > 0) = Total in membership / Total Enrollment
- Gender = Total in gender / Total Enrollment
- Ethnic Distribution = Total in ethnicity / Total Enrollment
- Student by Indicator = Total in program indicator / Total Enrollment
- Early Reading Indicator by Grade = Total by grade by indicator / Total of Early Reading Indicator by Grade
- Economic Disadvantage Percentages
- Free, Reduced, Other = Total in status / Total Economic Disadvantage
- Total Economic Disadvantage = Total Economic Disadvantage / Total Enrollment
- Regular, Special Education = Total in program / Total Enrollment
- Emergent Bilingual (LEP renamed in 2021-2022)
- Emergent Bilingual Percentages = Total in EB code / Total Enrollment
- Regular, Special Education = Total in program / Total Enrollment
- Total Emergent Bilingual = Total EB / Total Enrollment
- Bilingual by Program Percentages
- Bilingual by Progam = Total in program / Total Bilingual Program
- Total Bilingual Progam = Total Bilingual Program / Total Enrollment
- English Second Language (ESL) Percentages
- ESL by Program = Total in progam / Total ESL Program
- Total ESL Program = Total ESL Program / Total Enrollment
- Foster Care Percentages
- Foster Care by code = Total in foster care code / Total Foster Care Program
- Total Foster Care Program = Total Foster Care Program / Total Enrollment
- Homeless
- Homeless by code = Total in homeless code / Total Homeless
- Total Homeless = Total Homeless / Total Enrollment
- Unaccompanied Youth Percentages
- Unaccompanied Youth by code = Total in Unaccompained Youth code / Total Unaccompanied Youth
- Total Unaccompanied Youth = Total Unaccompanied Youth / Total Enrollment
- Military Connected Percentages
- Military Connected by code = Total in Miliatry Connected code / Total Military Connected
- Total Military Connected = Total Military Connected / Total Enrollment
- RDSPD Percentage = Total by RDSPD code / Total Enrollment
- Special Education Disability Percentages
- Special Education Disability by indicator = Total Special Education Disability indicator / Total Special Education Enrollment
- Total Special Education = Total Special Education / Total Enrollment
- Student Attribution Percentages = Total attribution code / Total Enrollment
- Title I Percentages
- Individual Title I codes = Total in Title I code / Total Title I
- Total Title I = Total Title I / Total Enrollment
- College & Career Readiness School Models Percentages
- College & Career Readiness School Models Indicators = Associate Degree, Early College High School, New Tech, P-Tech and T-STEM
- By Indicator = Total by Indicator / Total Advanced Academics
- Total Advanced Academics = Total Advanced Academics / Total Enrollment
Features:
- Filter on:
- Year – Default to 2023-2024
- Multi-select Campus (default to All)
- Focus list to run counts and percentages on groups of students (ex. SPED)
- Drill down on counts to see a detailed list of students
- Tools drop-down:
- Hide Zero Value Rows to hide null or zero value rows for years selected
- Show Zero Value Rows to show null or zero value rows for years selected (default)
- Turn on Heatmap to see hotspots/data swings at the district or campus level.