A frequency distribution shows you how many students scored at each level on your assessment. It’s basically a way to see the pattern of your class’s performance at a glance.
Think of it this way: Instead of looking at 25 individual test scores, you group them to see “How many students got A’s? How many got B’s?” etc. This gives you the big picture of how your class performed.
Simple Example: Your 20-student class takes a quiz scored out of 10 points:
- 9-10 points: 3 students
- 7-8 points: 8 students
- 5-6 points: 6 students
- 3-4 points: 2 students
- 1-2 points: 1 student
What Different Patterns Tell You:
Normal/Bell Curve Distribution (Most students in the middle):
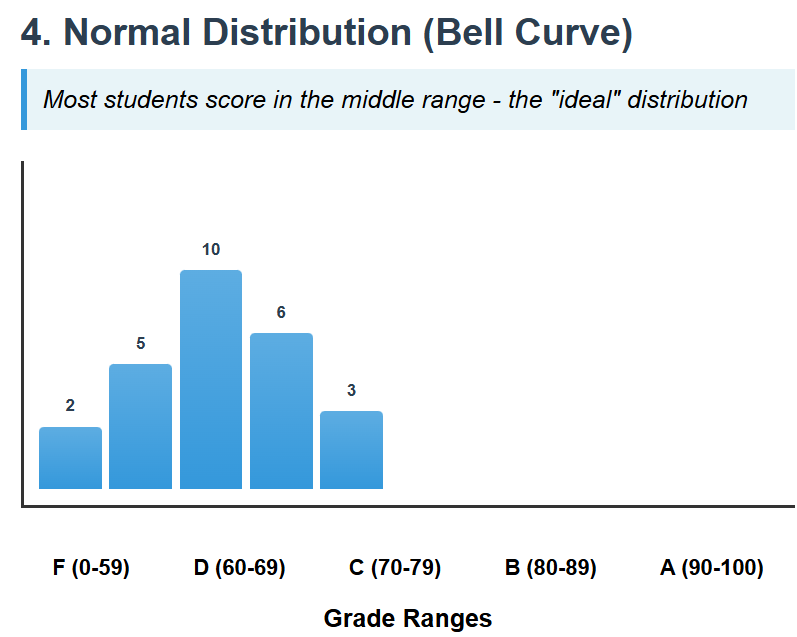
- Few students at very high scores
- Most students in the middle range
- Few students at very low scores
- What it means: Assessment difficulty was appropriate for your class
Skewed High (Most students did well):
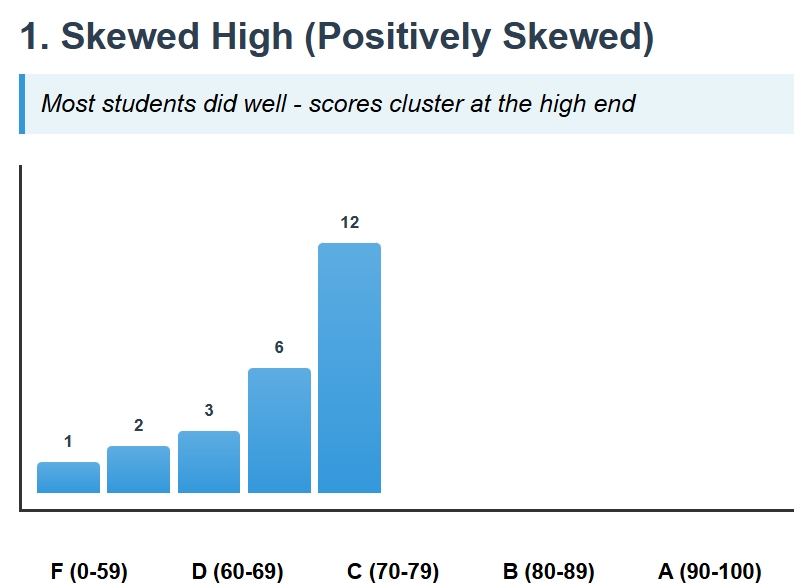
- Many students scored high
- Few students scored low
- What it might mean: Test was too easy, or you taught the material very effectively
Skewed Low (Most students struggled):
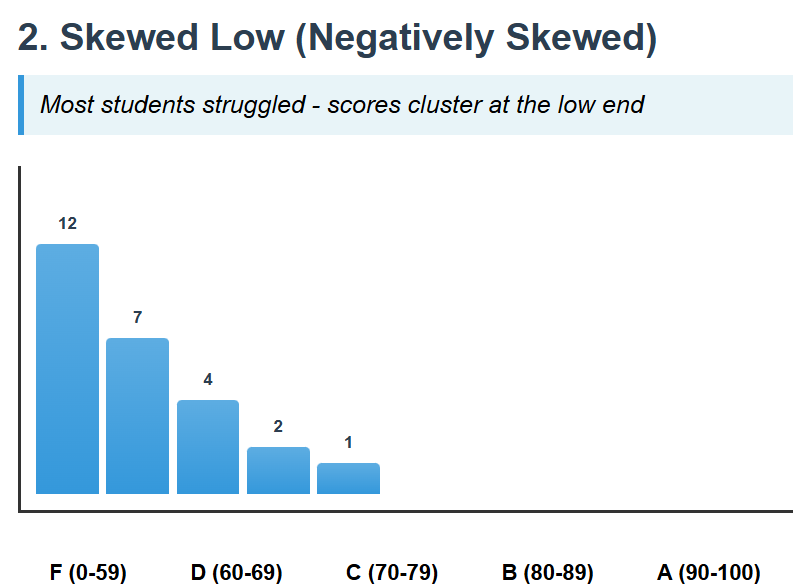
- Many students scored low
- Few students scored high
- What it might mean: Test was too hard, material needs re-teaching, or questions were confusing
Flat Distribution (Scores spread evenly):
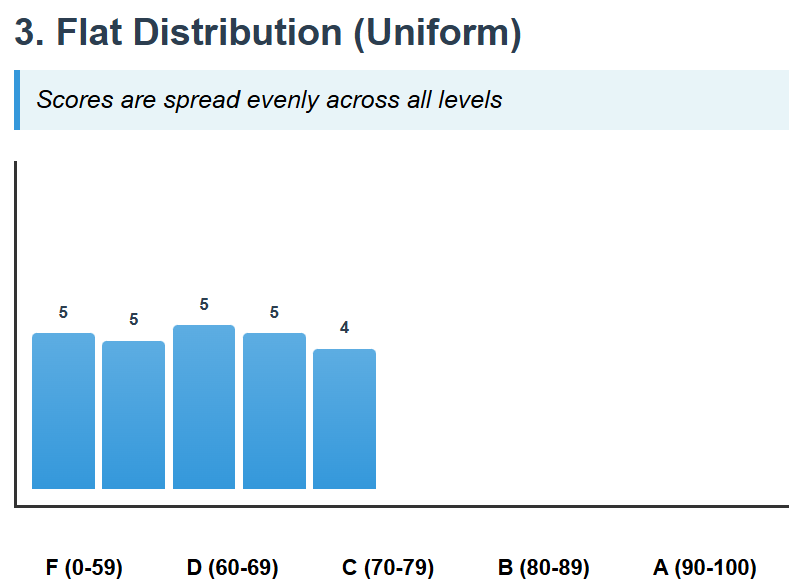
- Equal numbers of students at all score levels
- What it might mean: Assessment may not be measuring learning effectively
Bimodal (Two distinct groups):
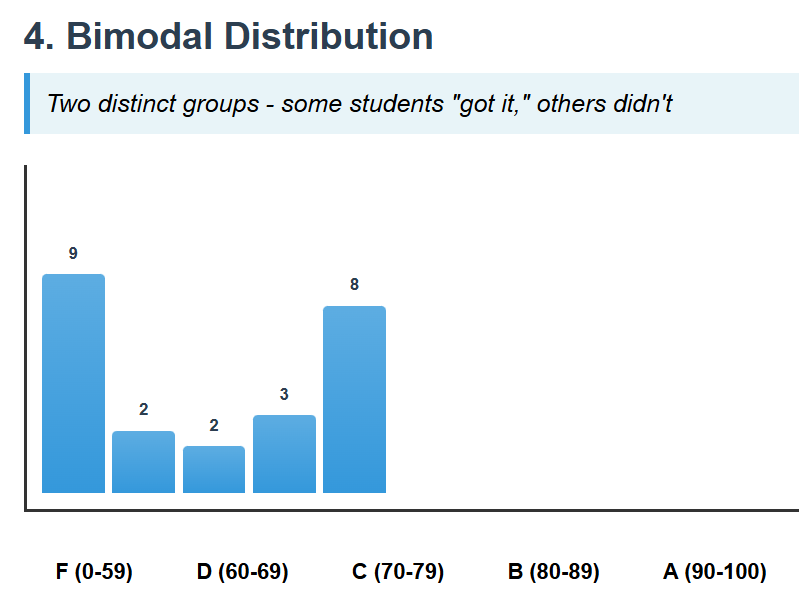
- Some students did very well
- Some students did very poorly
- Few students in the middle
- What it might mean: Some students “got it,” others didn’t—may need differentiated instruction
What This Helps You Do:
Adjust Your Teaching:
- If most students scored low: Re-teach the concept
- If most students scored high: You can move on or add challenge
Improve Your Assessments:
- Flat distribution might mean unclear questions
- Extreme skewing might mean inappropriate difficulty
Plan Interventions:
- Identify which students need extra help
- See if the whole class needs review
Communicate with Parents:
- “Your child scored in the top group of the class”
- “Most students found this challenging, so we’re spending more time on it”
Quick Visual Check: Draw a simple bar graph of your scores. The shape tells you immediately how your class performed and what you might need to do next!