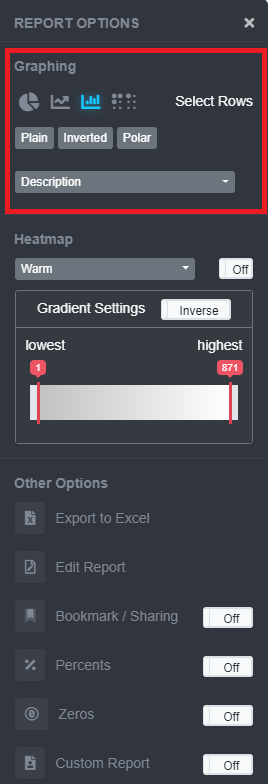
Graphing – provides options for visualizing data
- Pie chart, trend line, bar graph, or bubble graph
- First 5 codes automatically selected
- Hover over graph results to highlight specific codes
- To turn off graph, click on graph image again
- Trend Line and Bar Graphs Only:
- Inverted – switch the X and Y axis
- Polar
- Click legend elements on and off to readjust graph
- Drop-down for legend tags at bottom of graph
- Code
- Description (Default)
- Code-Description
- Click “Print/Download” far right-hand side to:
- “Full Screen” to display only the graph; Click “Exit Full Screen” to return to graph and data chart results
- “Show Values” to display the values on the graph; Click “Hide Values” to remove values
- Print or download the graph in several formats