Accountability>Federal: Accountability Report Center>State Performance Plan Indicators
Summary: The State Performance Plan indicator report reveals any disproportionate Suspension or Expulsions for Students with Disabilities.
The following formula is used to calculate the rates:
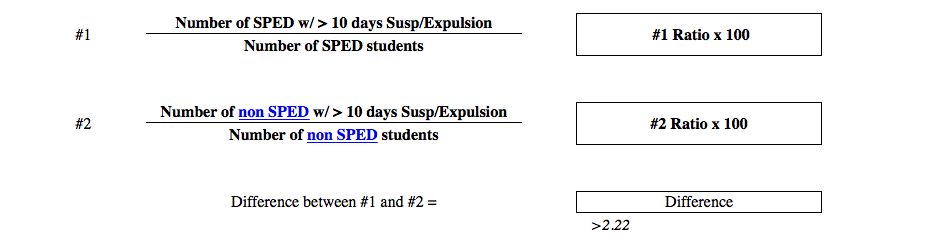
NOTE: For discrepancies in suspension/expulsion rates of students with disabilities, a district would need to be above the positive threshold in order to be identified as having a significant discrepancy. LEAs that exceed the 2.22 rate difference threshold are considered for reporting purposes to have a significant discrepancy in the discipline of students with disabilities.
Usage: Review disproportionate rates for the student SPED population as per TEA link below.
Special Notes:
- This report uses data from the prior school year. For example the 2021-2022 report uses data from the 20-21 school year.
- Discipline records only looking for Disciplinary Action Codes-E1005 (C164) = 01, 02, 03, 04, 05, 07, 09, 11, 12, 15, 25, 50, 51, 52, 53, 56, 58, 59, 61
Data Sources: PEIMS Summer records
Definitions:
- Campus Code: 9 Digit county District Campus Number
- Campus Name: Campus Name
- SPED With Discipline: Total number students having a PEIMS 42405 or 42505 record including mainstream and a special ed removal greater than 10 cumulative days.
- SPED Total: Total number students having a PEIMS 42405 or 42505 record including mainstream.
- Non SPED With Discipline: Total number students not in special education having a PEIMS 44425 discipline record with a removal greater than 10 cumulative days.
- Non SPED Total: Total students not in special education
Calculations:
- Calculated Rate Difference: See TEA Calculation Methodology
Features:
- Filter on:
- Single select Year (default most recent summer PEIMS year loaded)
- Race/Ethnicity
- Default All = 4A Indicator
- Select specific race/ethnicity = 4B Indicator