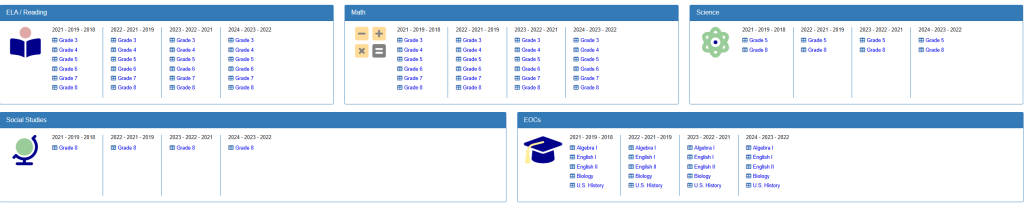
The Multi Year Comparison tool is designed to show trends for specific subject areas across several years. As shown in the screenshot, this feature organizes data by:
Subject Area Categories:
- ELA/Reading: Tracks reading performance across elementary and middle school grades
- Math: Monitors mathematics achievement from Grade 3 through Grade 8
- Science: Analyzes science performance for Grade 5 and Grade 8
- Social Studies: Reviews Grade 8 social studies results
- EOCs (End-of-Course): Examines high school subject performance including Algebra I, English I, English II, Biology, and U.S. History
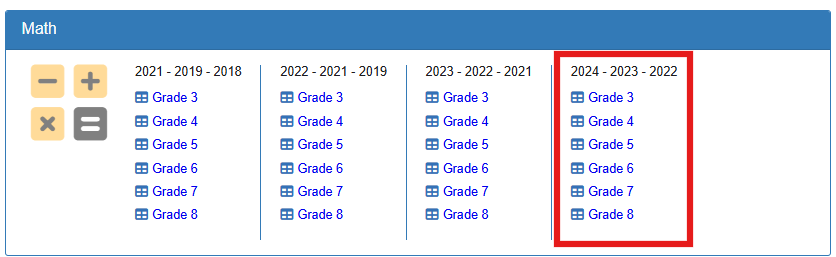
Time Period Analysis: The dashboard displays data across multiple three-year periods:
- 2021 – 2019 – 2018
- 2022 – 2021 – 2019
- 2023 – 2022 – 2021
- 2024 – 2023 – 2022
This rolling three-year view allows educators to see both recent trends and longer-term patterns in student achievement.
Note: Additional years are automatically added to the comparison options once testing is completed and the data is uploaded to the system, ensuring you always have access to the most current trends and historical comparisons.
Grade Level Organization: Each subject area shows performance data broken down by individual grade levels, making it easy to identify which grades may need additional support or are showing strong performance.
How the Scoring Works
Instead of looking at raw test scores, the multi year comparison report uses standardized scores that compare your students’ performance to all students across Texas. Think of it like a report card where:
- Scores above zero mean students performed better than the state average
- Scores at zero mean students performed right at the state average
- Scores below zero mean students performed below the state average
This system makes it fair to compare different subjects and different years, even when the tests might be slightly harder or easier.
Multi Year Comparison Mathematics Example
Here’s a detailed look at how the Multi Year Comparison works using Grade 7 Mathematics as our example. This will help you understand what you’re seeing and how to use this information effectively.
What You’re Looking At
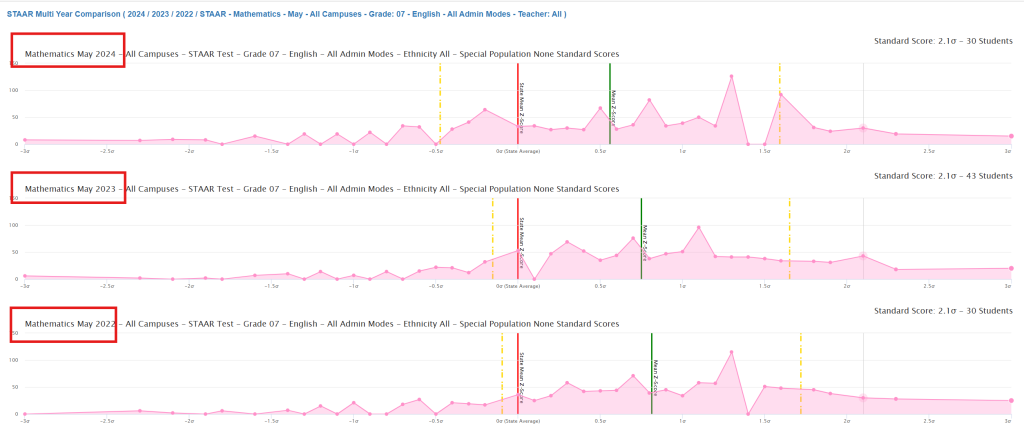
The screenshots show three years of Grade 7 Mathematics STAAR results (2024, 2023, and 2022) for all campuses combined. Each pink area represents how your students’ scores are distributed compared to the state average.
Understanding the Chart Elements
The Pink Areas (Distribution Curves):
- Each pink “mountain” shows how many students scored at different levels
- Taller peaks mean more students scored in that range
- Wider spreads mean more variety in student performance
The Vertical Lines:
- Red line: State average (where Texas students typically score)
- Green line: Your students’ average performance
- Yellow lines: Standard deviation boundaries – this is crucial information!
The 68% Rule: What Those Yellow Lines Really Tell You
The yellow lines mark one standard deviation above and below your students’ average. Here’s why this matters:
In any normal distribution, approximately 68% of your students’ scores fall between those two yellow lines.
Let’s look at what this means for each year:
2024 Mathematics:
- Standard Deviation: 1.03
- 68% of your 1,164 students (about 791 students) scored between the two yellow lines
- This tells you how “spread out” your students’ performance was
2023 Mathematics:
- Standard Deviation: 0.90
- 68% of your 1,113 students (about 757 students) scored between the yellow lines
- Notice this is a smaller spread than 2024
2022 Mathematics:
- Standard Deviation: 0.91
- 68% of your 1,125 students (about 765 students) scored between the yellow lines
- Very similar spread to 2023
What This Standard Deviation Analysis Reveals
2023 Was Your Most Consistent Year:
- Highest average score (0.75) AND lowest standard deviation (0.90)
- This means not only did students perform better on average, but they were also more consistent
- Fewer students struggling at the bottom, fewer extreme high performers – more students clustered around solid performance
2024 Shows More Variability:
- Standard deviation increased to 1.03 (the highest of the three years)
- While the average (0.56) is still above state level, you have more students at both extremes
- This suggests greater inequality in math achievement that year
Practical Implications for Teachers
Why This Matters:
- High average + Low standard deviation = Ideal situation (like 2023)
- Most students are performing well consistently
- Your instruction is reaching most students effectively
- High standard deviation = Red flag for equity
- Some students are excelling while others may be struggling significantly
- You might need differentiated instruction or intervention strategies
- Trend Analysis:
- 2022-2023: Improving consistency (standard deviation dropped from 0.91 to 0.90)
- 2023-2024: Increasing variability (standard deviation jumped to 1.03)
Action Steps Based on This Analysis
Questions to Investigate:
- What made 2023 special? – Both high performance AND consistency
- What happened in 2024? – Why did variability increase even though average remained good?
- Are there specific student populations showing more variability in 2024?
Focus Areas:
- Identify the struggling students within that 68% range
- Develop targeted interventions for students falling outside the yellow lines
- Replicate 2023 practices that created both high performance and consistency
Remember: A lower standard deviation means your teaching strategies are working for more students consistently. This is often more important than just having a high average score!