The Compare Subjects section provides three powerful tools for analyzing STAAR performance across subject areas and over time. This section helps educators identify trends, patterns, and areas of strength or concern across their curriculum. These reports enables comprehensive analysis of STAAR test performance through standardized z-score calculations, allowing for meaningful comparisons across different subjects, years, and student populations.
How the Scoring Works
Instead of looking at raw test scores, this dashboard uses standardized scores that compare your students’ performance to all students across Texas. Think of it like a report card where:
- Scores above zero mean students performed better than the state average
- Scores at zero mean students performed right at the state average
- Scores below zero mean students performed below the state average
This system makes it fair to compare different subjects and different years, even when the tests might be slightly harder or easier.
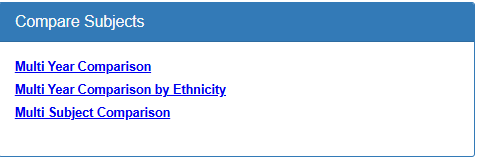
Multi Year Comparison Dashboard
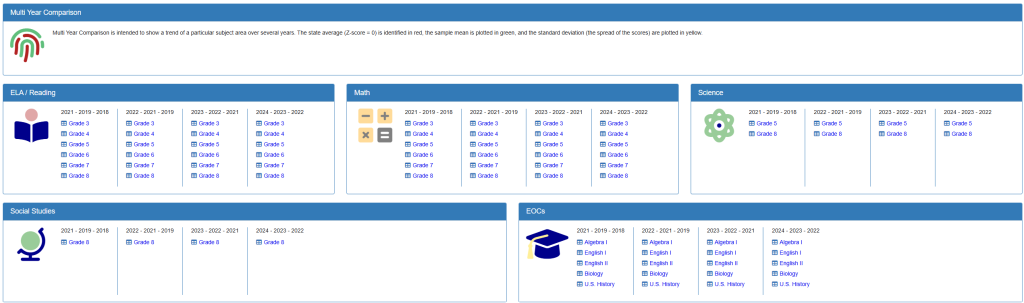
The Multi Year Comparison tool is designed to show trends for specific subject areas across several years. As shown in the screenshot, this feature organizes data by:
Subject Area Categories:
- ELA/Reading: Tracks reading performance across elementary and middle school grades
- Math: Monitors mathematics achievement from Grade 3 through Grade 8
- Science: Analyzes science performance for Grade 5 and Grade 8
- Social Studies: Reviews Grade 8 social studies results
- EOCs (End-of-Course): Examines high school subject performance including Algebra I, English I, English II, Biology, and U.S. History
Time Period Analysis: The dashboard displays data across multiple three-year periods. Currently shown periods include:
- 2021 – 2019 – 2018
- 2022 – 2021 – 2019
- 2023 – 2022 – 2021
- 2024 – 2023 – 2022
Note: Additional years are automatically added to the comparison options once testing is completed and the data is uploaded to the system, ensuring you always have access to the most current trends and historical comparisons.
This rolling three-year view allows educators to see both recent trends and longer-term patterns in student achievement.
Grade Level Organization:
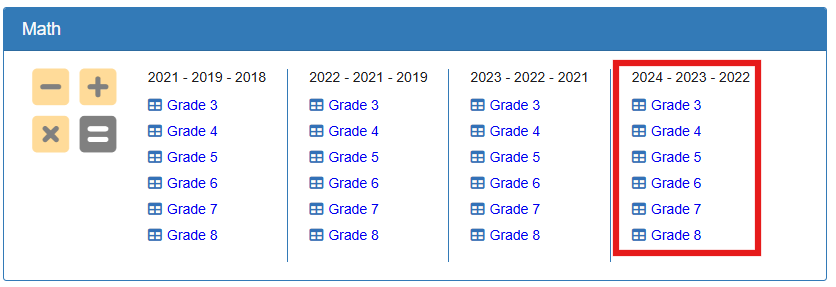
Each subject area shows performance data broken down by individual grade levels, making it easy to identify which grades may need additional support or are showing strong performance.
Multi Year Comparison by Ethnicity
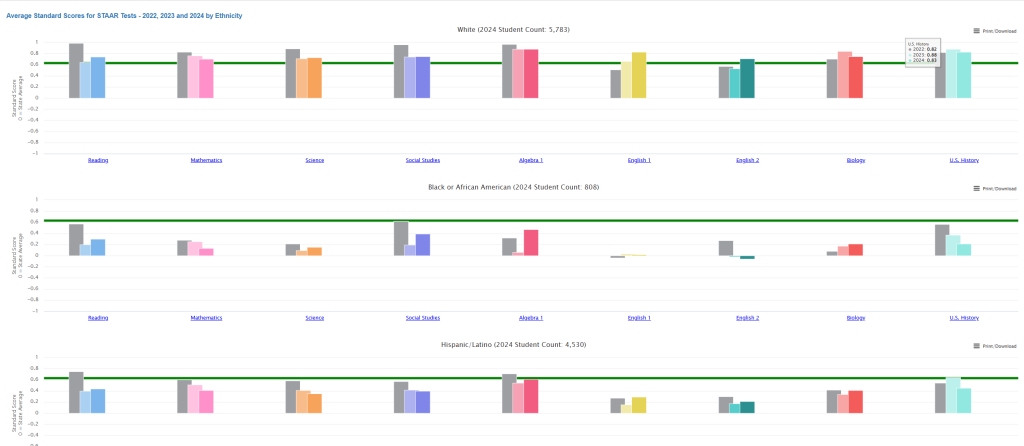
This component provides the same multi-year analysis but segments the data by student ethnicity, helping educators identify and address achievement gaps among different student populations.
Multi Subject Comparison
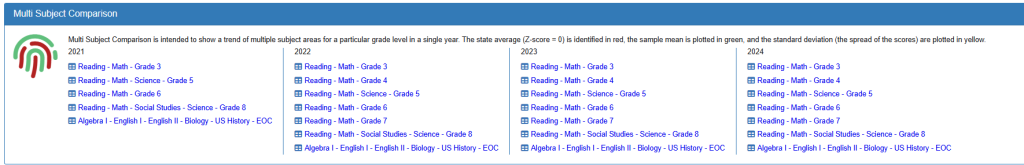
This tool allows direct comparison of performance across different subject areas for the same time period, helping educators understand curriculum strengths and areas needing improvement.
Key Features:
- Color-coded visualization: The state average (z-score = 0) is identified in red, sample means are plotted in green, and standard deviation spreads are shown in yellow
- Grade-level specificity: Each grade level within subjects can be analyzed individually
- Comprehensive coverage: Includes all STAAR-tested subjects from elementary through high school
- Dynamic data updates: New testing years are seamlessly integrated as they become available
Note: Additional detailed examples and step-by-step instructions will be provided using for each specific area to demonstrate how to effectively use each comparison tool.
This section empowers educators to make data-driven decisions about curriculum focus, resource allocation, and instructional strategies based on comprehensive multi-year performance analysis.