What This Chart Shows You
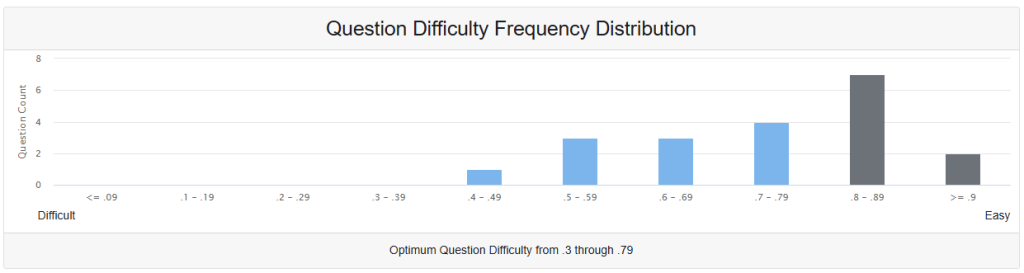
The Question Difficulty Distribution chart helps you understand how challenging your assessment questions are for students. It shows you the P-Value for each question, which is simply the percentage of students who answered that question correctly.
Understanding P-Values (Difficulty Levels)
P-Value tells you what percentage of students got a question right:
- 0.1 = 10% of students answered correctly (very difficult)
- 0.5 = 50% of students answered correctly (moderate difficulty)
- 0.8 = 80% of students answered correctly (easy)
Reading Your Current Distribution
Looking at this chart, here’s what this assessment looks like:
Question Difficulty Breakdown:
- Very Difficult Questions (10-29% correct): You have none
- Moderately Difficult Questions (30-49% correct): You have 1 question
- Moderate Questions (50-69% correct): You have 3-4 questions
- Moderately Easy Questions (70-79% correct): You have 4 questions
- Easy Questions (80%+ correct): You have 7 questions (your highest group)
The “Sweet Spot” (30-79% correct)
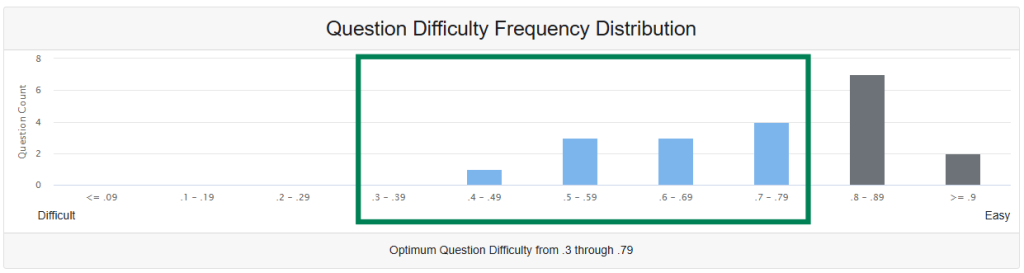
The highlighted blue section shows your optimal difficulty range. Questions in this range are most valuable because they:
- Help you identify which students truly understand the material
- Separate high-performing students from struggling students
- Provide the most useful information about student learning
What This Means for Your Teaching
Current Strengths:
- Most of your questions fall within the useful range
- Students are generally succeeding on your assessment
- Your instruction appears to be effective for the majority of content
Areas for Improvement:
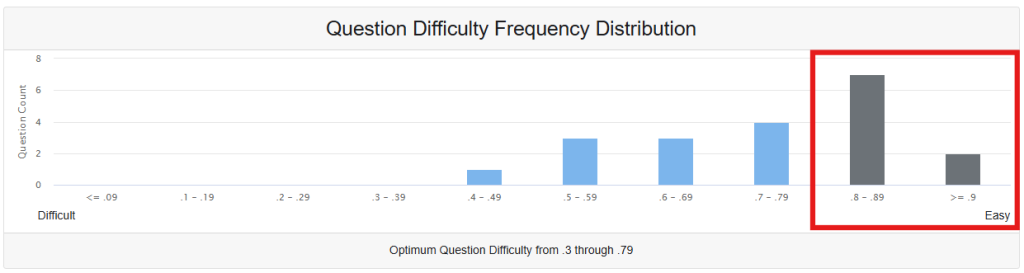
- Too many easy questions: Seven questions that 80%+ of students get right may not be telling you much about student understanding
- Missing challenging questions: No very difficult questions means you might not be identifying your highest achievers
- Opportunity for better balance: Adjusting the mix could give you more detailed information about student learning
Recommendations for All Educators
Ideal Question Mix for Most Assessments:
- 10-20% challenging questions (30-50% of students get them right)
- 60-70% moderate questions (50-70% of students get them right)
- 10-20% easier questions (70-85% of students get them right)
- Very few “gimme” questions (over 90% correct)
Practical Applications:
For New Teachers:
- Use this data to adjust future assessments
- If too many questions are too easy, consider adding more complex thinking tasks
- If questions are too hard across the board, review your instruction pacing
For Experienced Teachers:
- Use this analysis for item banking and test refinement
- Consider this distribution when creating formative vs. summative assessments
- Apply these insights when collaborating with grade-level or subject teams
For Department Leaders:
- Use this data to ensure consistency across teachers and sections
- Identify professional development needs around assessment design
- Support curriculum alignment discussions
Using This Information
Immediate Actions:
- Review your easiest questions: Are they measuring important concepts or just recall?
- Consider adding challenge: Include questions that require higher-order thinking
- Maintain your strengths: Keep the good balance you have in the moderate range
Long-term Planning:
- Build a question bank with varied difficulty levels
- Align question difficulty with your learning objectives
- Use this data to inform your instructional decisions
Remember:
The goal isn’t to make assessments harder for the sake of difficulty, but to create assessments that give you the clearest picture of what each student has learned and where they need support.