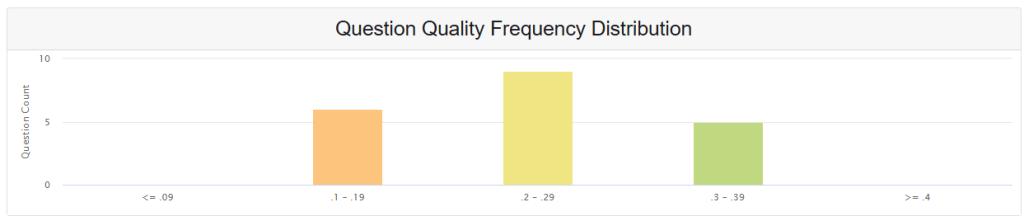
The Question Quality Frequency Distribution chart displays the distribution of point biserial correlation coefficients across test items, providing a comprehensive view of item discrimination quality within an assessment instrument.
Point Biserial Correlation Definition
Point biserial correlation (rpb) measures the strength of association between a dichotomous variable (typically item response: correct/incorrect) and a continuous variable (usually total test score). This metric serves as a primary indicator of item discrimination quality.
Formula and Calculation
The point biserial correlation coefficient is calculated using:
rpb = (Mp – Mq) / St × √(p × q)
Where:
- Mp = Mean total score for examinees who answered the item correctly
- Mq = Mean total score for examinees who answered the item incorrectly
- St = Standard deviation of total scores for all examinees
- p = Proportion of examinees who answered correctly
- q = Proportion of examinees who answered incorrectly (1-p)
Distribution Analysis
Current Distribution Characteristics
From the displayed distribution:
- Peak Performance: Highest frequency (8 items) falls within the 0.2-0.29 range (acceptable quality)
- Balanced Distribution: Moderate representation across good (0.3-0.39) and below-average (0.1-0.19) ranges
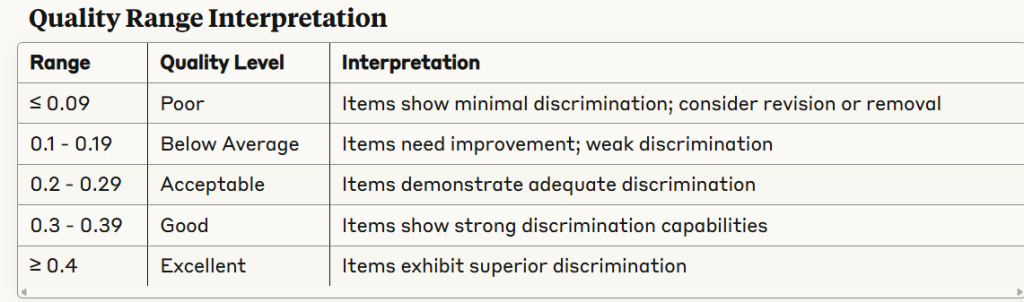
- Quality Indicators: No items in the poor (≤0.09) or excellent (≥0.4) categories suggest consistent but improvable item quality
Technical Considerations
Discrimination Index Relationship
Point biserial correlation relates directly to classical discrimination index (D) through: D = (U – L) / n Where U = upper group correct responses, L = lower group correct responses, n = group size
Item Difficulty Impact
Optimal point biserial values occur when item difficulty (p-value) approaches 0.5, following the relationship: Maximum rpb ≈ √(p × q)
Assessment Recommendations
Immediate Actions:
- Review items in 0.1-0.19 range for content clarity and key validity
- Analyze distractor effectiveness for items below 0.2 threshold
- Consider pilot testing revised items before implementation
Quality Assurance:
- Target distribution should show majority of items in 0.2+ ranges
- Investigate items with negative point biserial values (indicating reverse discrimination)
- Monitor correlation stability across different examinee populations
This distribution analysis enables data-driven decisions for assessment improvement and ensures measurement reliability within the OnTarget assessment framework.