
What Are Standard Scores?
Standard scores are a way to compare student performance across different STAAR subjects and years, even when the tests have different difficulty levels or scoring scales. Think of them as a “common language” that helps us make fair comparisons between subjects like Reading and Math, or between this year’s results and last year’s.
OnTarget’s Standard Scores Subject Comparison Report places student scores on a standard scale so you can compare student performance on different STAAR tests and make meaningful subject-to-subject comparisons.
How Standard Scores Work
The Scoring Process
Standard scores are created by comparing individual or group performance to the average performance of all students who took the same test. Here’s how it works:
- Reference Point: The state mean (average) becomes the reference point and is set at zero on the scale
- Comparison: Each score is compared to this state mean
- Standardization: Scores are converted to show how far above or below the state mean they fall
- Consistent Scale: All subjects use the same scale with zero representing the state mean, making comparisons possible
What the Numbers Mean
The zero line represents the state mean – this is the average performance of all Texas students who took that particular STAAR test.
- Zero (0): Exactly at the state mean – your students performed at the same level as the average Texas student
- Positive numbers (above the zero line): Above the state mean – your students outperformed the average Texas student (the higher, the better)
- Negative numbers (below the zero line): Below the state mean – your students performed lower than the average Texas student (the lower, the more concerning)
- Typical range: Most scores fall between -3.0 and +3.0
Reading Your Data
Understanding the Chart
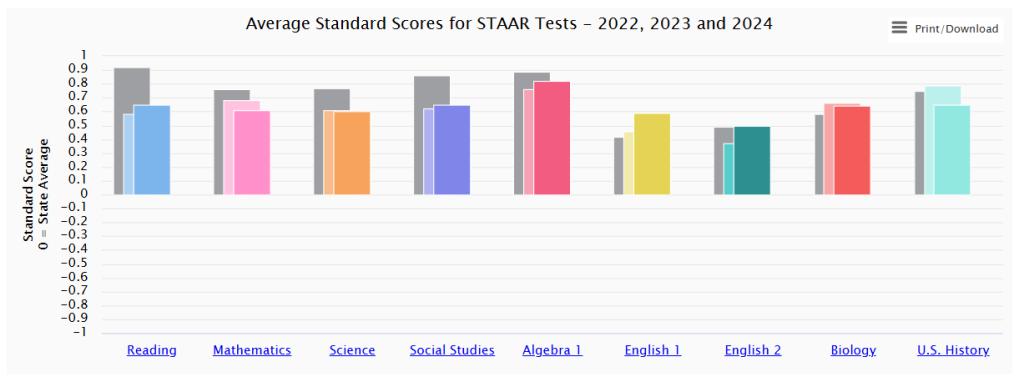
Strong Performance Areas:
- U.S. History (~0.75): Well above state average
- Algebra 1 (~0.8): Strongest performance shown
- Biology (~0.65): Above average performance
Near Average Performance:
- English 1, English 2, Social Studies: All showing positive but modest gains above state average
Areas Needing Attention:
- Any subjects showing negative scores would indicate below-average performance compared to the state
What This Means for Your Students
Positive Scores (above the zero line): Your students are performing better than the state mean in that subject. The higher above zero, the better the performance relative to the typical Texas student.
Scores Near Zero (at the zero line): Your students are performing similarly to the state mean – they’re right at the average for Texas students. This isn’t necessarily bad, but there may be room for growth.
Negative Scores (below the zero line): Your students are performing below the state mean, indicating an area where additional support or instructional changes might be beneficial to reach at least the state average level.
Why Standard Scores Matter
Fair Comparisons
Standard scores solve several important problems:
- Different test difficulties: A “hard” test year vs. an “easy” test year
- Subject-to-subject comparison: Comparing Reading performance to Math performance
- Year-to-year tracking: Seeing genuine improvement over time
Practical Applications
For Teachers:
- Identify your strongest and weakest subject areas
- Track improvement over multiple years
- Compare your classroom/grade level to district and state performance
For Administrators:
- Make data-driven decisions about curriculum and resources
- Identify successful teaching practices in high-performing areas
- Target professional development and support where needed
Important Things to Remember
Context Matters
Standard scores show relative performance, not absolute mastery. A positive score means “better than average,” but you should still consider:
- Are students meeting grade-level expectations?
- What does “average” mean for your specific student population?
- How do these results align with other measures of student progress?
Limitations to Keep in Mind
- Sample size: Smaller groups may show more variation
- Population changes: Student demographics can shift over time
- Test changes: STAAR has evolved, affecting year-to-year comparisons
- Multiple factors: Many variables beyond instruction affect test performance
Using This Information Effectively
For Instruction Planning
High-performing areas: Study successful practices and consider how to apply them to other subjects
Average performance: Look for specific skills or concepts that could be strengthened
Areas of concern: Consider additional instructional time, different teaching strategies, or targeted interventions
For Professional Growth
Use standard scores to:
- Set realistic improvement goals
- Identify areas for professional development
- Collaborate with colleagues in high-performing areas
- Track the effectiveness of instructional changes over time
Getting More from Your Data
Additional OnTarget Features
OnTarget provides several reports that build on standard scores:
- Group comparisons: Compare your results to similar schools or districts
- Growth analysis: Track improvement over time accounting for various factors
- Detailed breakdowns: Examine performance by student subgroups
Questions to Ask
When reviewing your standard scores, consider:
- What instructional practices contributed to strong performance areas?
- Where do students need additional support?
- How can successful strategies be applied to other subjects?
- What resources or professional development would be most beneficial?
The Bottom Line
Standard scores give you a clear, fair way to understand how your students are performing compared to their peers across Texas. They help identify strengths to celebrate and areas that need attention, making your instructional planning more focused and effective.
Remember: these scores are one important piece of information about student performance, but they work best when combined with your professional judgment and knowledge of your students’ individual needs and growth.
For questions about specific OnTarget reports or features, consult your district’s data coordinator or the OnTarget support resources.