OnTarget’s Standard Scores Subject Comparison Report places student scores on a standard scale to allow you to compare student performance on 3 distinct STAAR test including subject to subject comparison. The Average Standard Scores for STAAR shown in this report represent normalized z-scores that enable cross-year and cross-subject comparisons by converting raw STAAR performance data into standardized units.
Standardized Z-Score Methodology
Basic Formula
The standardized z-score used in OnTarget’s STAAR analysis follows the fundamental statistical formula:
z = (x – μ) / σ
Where:
- z = standardized score (z-score)
- x = individual raw score or group mean raw score
- μ = population mean raw score
- σ = population standard deviation
OnTarget Implementation
A standard score is a common unit of measurement which allows OnTarget to compare variables that measure scores from different scales; however, it does not account for the variance within and between groups. In the context of STAAR data analysis, OnTarget calculates standardized scores by:
- Data Aggregation: Raw STAAR scores are aggregated by subject, grade level, and academic year
- Population Parameters: Mean and standard deviation are calculated from the relevant population (state, district, or comparison group)
- Standardization: Individual or group raw scores are converted using the z-score formula
- Scaling: The resulting z-scores maintain their original distributional properties with mean = 0 and standard deviation = 1
Technical Specifications
Score Range and Interpretation
- Range: Theoretical range is -∞ to +∞, but practical range typically falls between -3.0 and +3.0
- Mean: 0.0 (by mathematical definition)
- Standard Deviation: 1.0 (by mathematical definition)
- Interpretation:
- Positive values: Performance above the reference population mean
- Negative values: Performance below the reference population mean
- Magnitude: Distance from mean in standard deviation units
Reference to TEA Technical Documentation
The TEA Technical Digest provides detailed information about mean item scores and internal consistency values by reporting category and content area. The internal consistency measures (Coefficient Alpha) reported in TEA technical documentation typically range from 0.32 to 0.87 across different STAAR subjects and grade levels, indicating acceptable to good reliability for standardized score calculations.
Sample Internal Consistency Values from TEA Technical Digest:
- Reading Overall Test: α = 0.84 (Grade 3, N = 6,583)
- Mathematics Overall Test: α = 0.85 (Grade 3, N = 6,586)
- Science Overall Test: α = 0.85 (Grade 5, N = 6,200)
Calculation Process
Step-by-Step Implementation
- Raw Score Collection: Gather STAAR raw scores for the specified subject and year
- Population Definition: Define reference population (typically state-level performance)
- Statistical Parameters:
- Calculate population mean (μ) from all raw scores in reference group
- Calculate population standard deviation (σ) using the formula: σ = √[Σ(x – μ)² / N]
- Standardization: Convert each score using z = (x – μ) / σ
- Averaging: For group reports, calculate the mean of individual z-scores
Quality Assurance
Scale scores allow direct comparisons of student performance between specific sets of test questions from different test administrations. A scale score is a conversion of the raw score onto a scale that is common to all test forms for that assessment. The standardized scores in OnTarget maintain comparability across different test administrations and years.
Data Visualization Interpretation
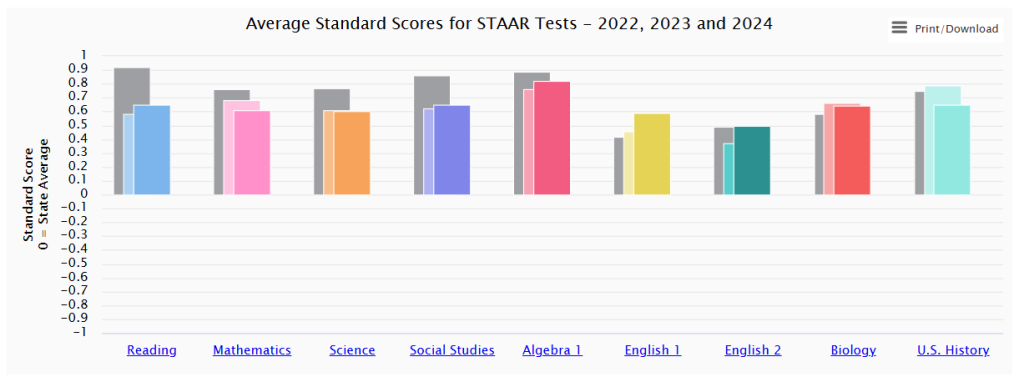
Chart Analysis (2022-2024 Data)
The screenshot shows standardized scores ranging approximately from -0.1 to +0.8 across nine STAAR subjects:
- Above Average Performance: U.S. History (~0.75), Biology (~0.65), Algebra 1 (~0.8)
- Near Average Performance: English 1 (~0.6), English 2 (~0.5), Social Studies (~0.6)
- Below Average Performance: Reading (~0.65), Mathematics (~0.6), Science (~0.6)
Note: These values represent performance relative to the state population mean, with positive values indicating above-average performance.
Statistical Properties and Assumptions
Distributional Assumptions
- Normality: STAAR raw scores approximate normal distribution within subject areas
- Independence: Individual student scores are independent observations
- Homoscedasticity: Variance is consistent across different score ranges
Limitations and Considerations
Standard Error of the Mean: Standard deviation of the sampling distribution of the mean. It tells how much variability there is between each sample mean. Users should consider:
- Sample size effects on standard error
- Year-to-year changes in test difficulty and population characteristics
- Subject-specific scaling differences
- Subgroup performance variations
Applications in OnTarget Analytics
Comparative Analysis
The standardized scores enable:
- Cross-subject performance comparison
- Multi-year trend analysis
- District-to-state performance evaluation
- Subgroup performance analysis
Integration with Other Metrics
OnTarget has developed several reports that utilize One- and Two-Sample difference tests which allow for the statistical determination of student growth which do account for the variances between and within groups.
References and Data Sources
- TEA Technical Digest: Contains detailed psychometric properties, internal consistency measures, and score distributions by content area and grade level
- STAAR Raw Score Conversion Tables: Provide the underlying data transformations from raw to scale scores
- OnTarget Analytics Platform: Implements standardized score calculations according to established statistical methodologies
For additional technical specifications or questions about implementation, refer to the TEA Technical Digest Mean P-Values and Internal Consistency Reports, available through the Texas Education Agency Student Assessment Division.