The STAAR Multi-Subject Comparison report is a powerful tool that helps you see how your students performed across Reading, Mathematics, and Science on a level playing field. Instead of comparing raw scores (which can vary between subjects), this report uses something called “standardized scores” to make fair comparisons possible.
Think of it like comparing athletes from different sports – you can’t directly compare a basketball player’s points to a swimmer’s times, but you can compare how each athlete performed relative to others in their sport. That’s exactly what this report does with test scores.
Understanding Z-Scores: The Key to Reading This Report
What is a Z-Score?
A z-score is simply a way of saying “how far above or below average is this score?” Instead of using the actual test scores, z-scores tell you:
- Zero (0) = exactly average (state performance)
- Positive numbers = above average (better than state)
- Negative numbers = below average (needs improvement)
Real-World Examples
- A z-score of +1.0 means performance is significantly above average (better than about 84% of all students statewide)
- A z-score of -1.0 means performance needs attention (lower than about 84% of students statewide)
- A z-score of +0.5 means solid above-average performance
- A z-score of -0.5 means slightly below average but not alarming
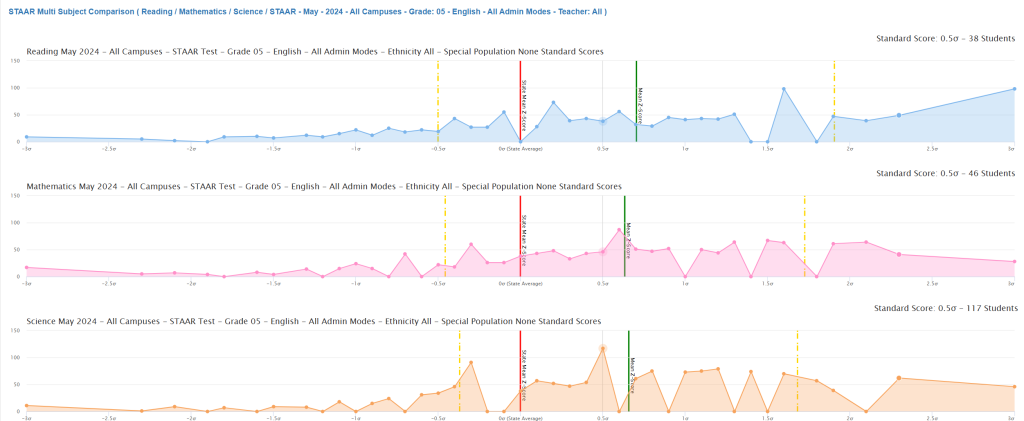
Reading the Visual Elements
The Three Colored Lines – Reading Example

Red Line (State Average): This is your measuring stick. It represents how the average Texas student performed. Everything to the right is above average; everything to the left is below average.
Green Line (Your District): This shows where your district’s average falls compared to the state. When it’s to the right of the red line, your district is outperforming the state average.
Yellow Lines (Checkpoints): These mark important performance levels. Students falling far to the left of these lines may need additional support, while those far to the right are excelling.
The Colored Areas (Performance Distributions)
Each subject has its own colored area showing how students are spread across performance levels:
- Tall, narrow peaks = most students performing similarly
- Wide, flat areas = students spread across many performance levels
- Multiple peaks = distinct groups of high and low performers
What Your District’s Data Reveals
Reading Performance (Blue Area)
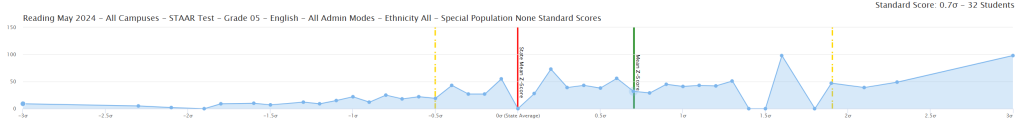
- 1,239 students tested
- District average: +0.70 (significantly above state average)
- Key insight: While overall performance is strong, there’s more variation in student scores than ideal. This suggests some students are excelling while others may need additional reading support.
Mathematics Performance (Pink Area)
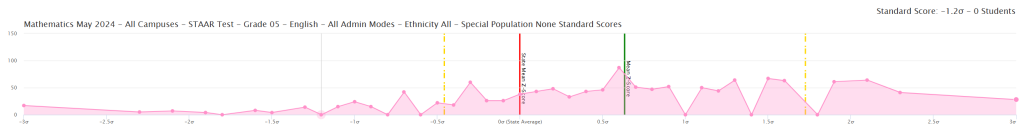
- 1,277 students tested
- District average: +0.63 (solid above-average performance)
- Key insight: Consistent performance with moderate variation. Most students are achieving well in mathematics with fewer extreme high or low scores.
Science Performance (Orange Area)
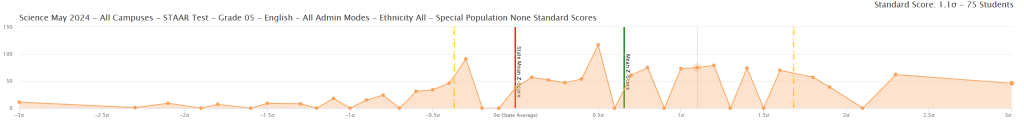
- 1,300 students tested
- District average: +0.66 (strong above-average performance)
- Key insight: This is your most consistent subject area. Students are performing well with the least amount of variation, indicating equitable science instruction.
What This Means for Your Classroom
Subject-by-Subject Insights
Reading Strengths and Opportunities:
- Your district’s reading program is producing strong results overall
- However, the wider variation suggests some students may be falling behind while others excel
- Consider differentiated reading instruction and targeted interventions for struggling readers
Mathematics Consistency:
- Solid, steady performance across the student population
- Good balance of challenge and support
- Continue current approaches while monitoring students at the lower end
Science Success Story:
- Most equitable performance across all subjects
- Whatever approaches are being used in science could serve as a model for other subjects
- Maintain current science instruction methods
Practical Applications
For New Teachers:
- Focus on students whose performance falls in the lower ranges (left side of distributions)
- Celebrate the strong overall district performance – you’re part of a successful system
- Use science teaching strategies as models for other subjects
For All Educators:
- Reading needs the most attention due to performance gaps
- Science instruction methods are working exceptionally well
- Mathematics instruction is solid but could benefit from science department strategies
Action Steps You Can Take
Immediate Classroom Applications
- Identify students who may need additional support (those likely performing below district averages)
- Collaborate with science teachers to understand their successful strategies
- Implement targeted interventions especially in reading where variation is highest
- Celebrate successes while addressing areas for growth
Long-term Planning
- Reading focus: Develop differentiated instruction plans to address the wide range of student performance
- Cross-curricular learning: Apply successful science teaching methods to reading and mathematics
- Data monitoring: Track individual student progress to ensure consistent growth across all subjects
Why This Matters
This report shows that your district is performing well above state averages in all three core subjects – that’s something to celebrate! However, it also reveals opportunities to make good performance even better by:
- Ensuring all students benefit from the strong instructional programs
- Reducing achievement gaps, particularly in reading
- Replicating the success seen in science across all subject areas
Remember, these scores represent just one snapshot of student learning. Combined with your daily classroom observations and other assessments, this data helps create a complete picture of how to best support every student’s academic growth.
Questions for Reflection and Discussion
- How does this district-level data align with what you observe in your classroom?
- What specific strategies might help reduce the performance variation in reading?
- How can the consistency shown in science inform instruction in other subjects?
- Which students in your classes might benefit from additional support based on these patterns?
Understanding this report empowers you to make informed decisions about instruction, intervention, and celebration of student success. Use it as one valuable tool in your toolkit for helping every student achieve their potential.