The STAAR Multi-Subject Comparison report displays student performance distributions across Reading, Mathematics, and Science using standardized z-scores. This statistical approach allows for direct comparison of performance across different subject areas by converting raw scale scores into a common metric that represents how many standard deviations a score falls above or below the mean.
Standardized Z-Score Formula and Calculation
The standardized z-score is calculated using the following formula:
z = (X – μ) / σ
Where:
- z = standardized score (z-score)
- X = individual student’s scale score
- μ = population mean (state mean)
- σ = population standard deviation
Example Calculation:
If a student receives a scale score of 1550 in Reading, and the state mean is 1500 with a standard deviation of 100:
- z = (1550 – 1500) / 100 = 0.5
This indicates the student performed 0.5 standard deviations above the state mean.
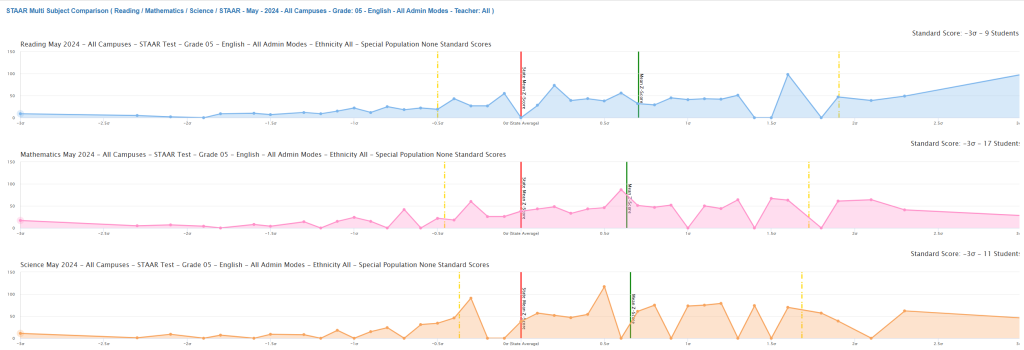
Reference Lines and Their Significance
Red Line (State Mean – μ = 0)
The red vertical line represents the state mean, which serves as the baseline (z = 0) for all comparisons. This line is derived from the TEA Technical Digest and represents the average performance of all Texas students who took the assessment.
Green Line (District Average)
The green vertical line shows the district’s mean performance relative to the state. When positioned:
- Right of red line: District performs above state average
- Left of red line: District performs below state average
- On red line: District performs at state average
Yellow Lines (Standard Deviation Markers)
The yellow vertical lines mark one standard deviation intervals (±1σ, ±2σ, ±3σ) from the state mean. These markers are critical for understanding performance distribution patterns.
Importance of Standard Deviation Analysis
Statistical Significance
Standard deviation analysis is crucial because it reveals:
- Performance Spread: How widely student scores are distributed
- Achievement Gaps: Identification of students performing significantly below expectations
- Intervention Targets: Students falling beyond -1σ may need additional support
- Excellence Identification: Students exceeding +1σ demonstrate above-average mastery
Normal Distribution Context
In a normal distribution:
- 68% of scores fall within ±1σ
- 95% of scores fall within ±2σ
- 99.7% of scores fall within ±3σ
Analysis of the Report Example
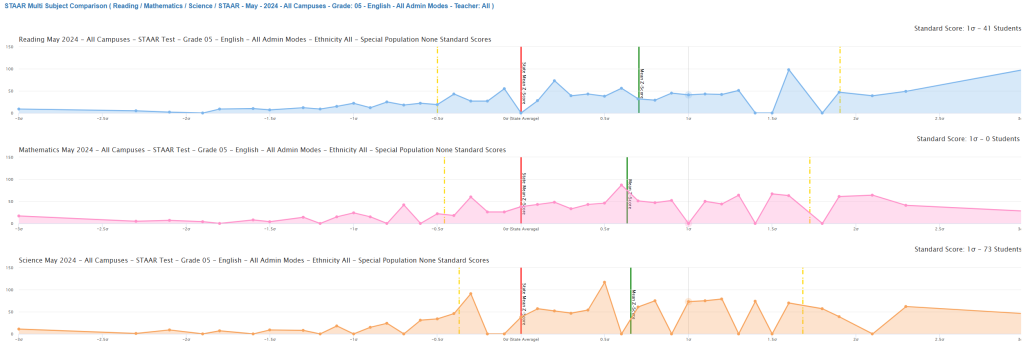
Reading Performance (Blue Distribution)
- District Mean: Appears slightly above state average (green line right of red)
- Distribution Shape: Relatively normal with slight positive skew
- Range: Students distributed from approximately -2σ to +3σ
- Peak Performance: Concentration around +1σ indicates strong reading achievement
Mathematics Performance (Pink Distribution)
- District Mean: Appears at or slightly below state average
- Distribution Shape: More variable than reading, with multiple peaks
- Concern Areas: Notable concentration of students below -1σ
- Achievement Gap: Wider spread suggests greater performance variability
Science Performance (Orange Distribution)
- District Mean: Appears slightly above state average
- Distribution Shape: Relatively compact distribution
- Positive Indicator: Good concentration around the mean with fewer extreme low performers
- Consistency: Less variability than mathematics
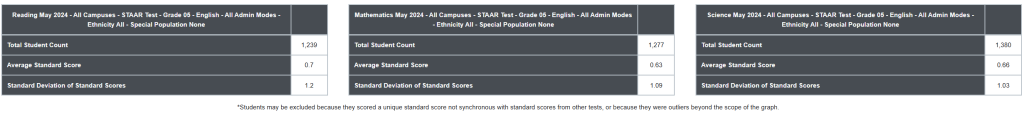
Quantitative Performance Summary
Based on the statistical data shown in the screenshot, here’s a detailed analysis of the district’s performance across all three subjects:
Reading Performance Analysis
- Sample Size: 1,239 students tested
- District Mean Z-Score: +0.70 standard deviations above state mean
- Performance Variability: Standard deviation of 1.2 indicates higher than expected variability
- Interpretation: Strong overall reading performance with 20% above average achievement
Mathematics Performance Analysis
- Sample Size: 1,277 students tested
- District Mean Z-Score: +0.63 standard deviations above state mean
- Performance Variability: Standard deviation of 1.09 shows moderate variability
- Interpretation: Solid mathematics achievement with consistent performance
Science Performance Analysis
- Sample Size: 1,300 students tested
- District Mean Z-Score: +0.66 standard deviations above state mean
- Performance Variability: Standard deviation of 1.03 indicates most consistent performance
- Interpretation: Strong science achievement with lowest performance gaps
Statistical Significance and Implications
Comparative Analysis
Subject Ranking by Performance:
- Reading: Highest mean performance (+0.70σ) but most variable (SD = 1.2)
- Science: Moderate-high performance (+0.66σ) with best consistency (SD = 1.03)
- Mathematics: Solid performance (+0.63σ) with moderate consistency (SD = 1.09)
Standard Deviation Interpretation
Expected vs. Actual Variability:
- Normal expectation: Standard deviation should approximate 1.0 for z-scores
- Reading concern: SD of 1.2 suggests achievement gaps within the district
- Science strength: SD of 1.03 indicates equitable instruction across student populations
- Mathematics: SD of 1.09 shows acceptable consistency
Performance Distribution Calculations
Percentage of Students by Performance Level
Using the normal distribution properties with the given statistics:
Reading (μ = 0.70, σ = 1.2):
- Students below state average: ~28%
- Students 1+ SD above state: ~35%
- Students needing intervention (<-1σ): ~8%
Mathematics (μ = 0.63, σ = 1.09):
- Students below state average: ~28%
- Students 1+ SD above state: ~30%
- Students needing intervention (<-1σ): ~9%
Science (μ = 0.66, σ = 1.03):
- Students below state average: ~26%
- Students 1+ SD above state: ~32%
- Students needing intervention (<-1σ): ~7%
Data Quality and Reliability Notes
Sample Size Considerations
The varying student counts across subjects (1,239-1,300) may indicate:
- Grade-level testing schedules affecting participation
- Student mobility during testing windows
- Assessment accommodation requirements
Exclusion Factors
The footnote indicates potential student exclusions for:
- Unique standard scores not synchronous with other tests
- Outlier performance beyond graphical scope
- Statistical anomalies requiring separate analysis
Actionable Recommendations
Priority Areas for Intervention
- Reading: Address high variability through differentiated instruction
- Mathematics: Maintain current performance while targeting lowest performers
- Science: Leverage consistent model for other subjects
Resource Allocation Implications
- Reading: Requires most intensive intervention resources due to high variability
- Science: Model program for replication in other subjects
- Mathematics: Moderate support needed for consistency improvement
Longitudinal Monitoring
Track these metrics across testing cycles to identify:
- Trend patterns in performance consistency
- Intervention effectiveness through reduced standard deviations
- Achievement gap closure through improved mean scores
This quantitative analysis provides administrators with precise targets for educational improvement and validates the visual patterns observed in the distribution charts.
Technical Considerations from TEA Documentation
Internal Consistency
According to TEA’s Internal Consistency reports, STAAR assessments demonstrate high reliability coefficients (typically >0.85), ensuring that z-score transformations accurately reflect true performance differences.
Scale Score Interpretation
TEA’s Technical Digest provides the statistical parameters necessary for z-score calculations:
- Mean scale scores by grade and subject
- Standard deviations for each assessment
- Standard error of measurement for precision estimates
Recommendations for Use
Data-Driven Decision Making
- Identify students below -1σ for targeted intervention
- Analyze subject-specific patterns to inform curriculum decisions
- Compare district performance across subjects using the green reference line
- Monitor progress by comparing distributions across testing cycles
Equity Analysis
The standardized format enables identification of:
- Achievement gaps between student populations
- Subjects requiring additional resources
- Consistency of instruction across subject areas
This technical approach transforms raw assessment data into actionable intelligence for educational improvement, providing administrators with precise tools for measuring and enhancing student achievement across all STAAR-tested subjects.