Report Location: Assessment > STAAR Grades 3-8 > STAAR 3-8 Student Detail > STAAR 3-8 Student SE Breakdown
Report Location: Assessment > STAAR End-of-Course> STAAR EOC Student Detail > STAAR EOC Student SE Breakdown
Required filter selections: As each filter is selected (left to right), the next filter will populate according to the prior filters selected.
- Subject (STAAR Test subject)
- Years (Test Years from files loaded) for respective test subject)
- Grades (applicable to test subject and year selected)
- Language (defaults to English when Test Version is selected)
The remaining filters are optional and again will populate with applicable data as filters are selected left to right:
- Campus (Defaults to All)
- Teacher of Record (Defaults to All) – *Note that the Teacher of Record filter information is pulled from Class Roster Winter Enrollment collection for the specified Subject, Years, Grades, etc. selected.
- Ethnicity (Defaults to All)
- Focus List (optional)
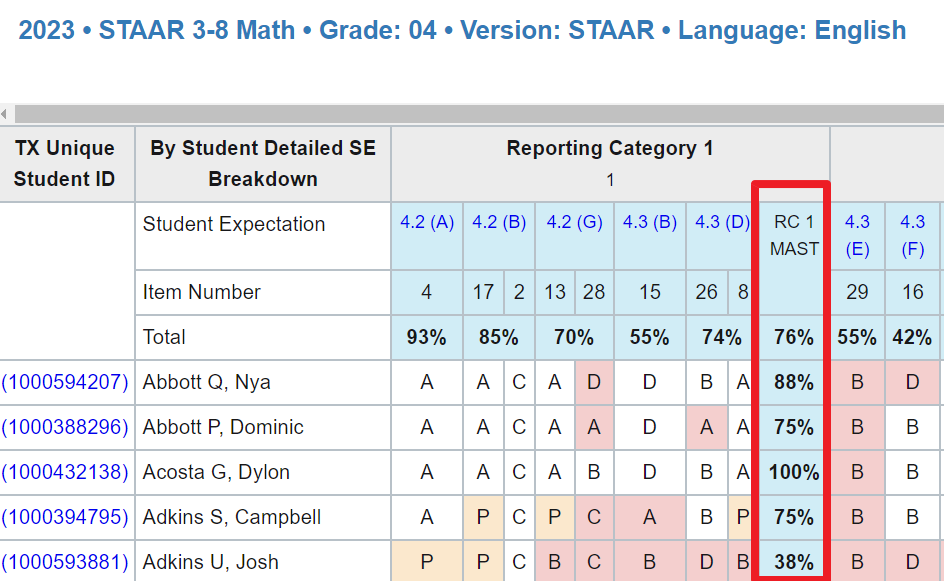
Reporting Category Grouping
The reporting category will group all associated Student Expectations by reporting category that were tested for the specified administration.
Key
ABCD– Incorrect
P– Partial Correct for new question types

RC MAST % – Reporting Category Mastery % is provided at the end of each grouped row which represents the total number of test items scored correctly over the total number of test items. Items that were missed will be highlighted in red.
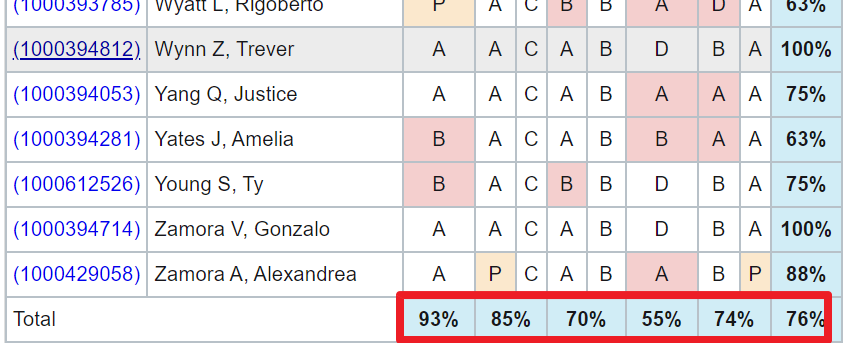
RC MAST Total % – At the bottom of each list an RC Mastery # Total % calculates the grouped reporting category row met values over the entire grouped reporting category tested values to provide a total percentage for the found reporting category.
Example: Reporting Category 1 RC 1 Mast %
Student A: 8 tested items correct / 8 tested items = 100%
Student B: 7 tested items correct / 8 tested items = 87.5%
Student C: 6 tested items correct / 8 tested items = 75.0%
Student D: 8 tested items correct / 8 tested items = 100%
Total: 29 total tested items correct / 32 tested items = 90.6%
Student Expectation (SE) Category Grouping
The Student Expectation (SE) category will group all associated Student Expectations by reporting category item numbers that were tested for the specified administration.
SE % Total– At the bottom of each list an SE total % calculates the grouped SE row met values over the entire grouped SE tested values to provide a total percentage for the found SE.
Example: SE % Total
Total: 13 total tested SE items correct / 16 total tested SE items = 81.2%
Overall Total Grouping
The overall % correct by row
The overall % correct by row represents the total number of missed items, total tested items and total correct responses per row for all reporting categories.
The overall total %
The overall total % correct represents the total number of missed items, total tested items and total correct responses for all rows for all reporting categories.