- Associated Instructional Materials
- Video: How to Modify User Accounts
Location: Administrator>Logs
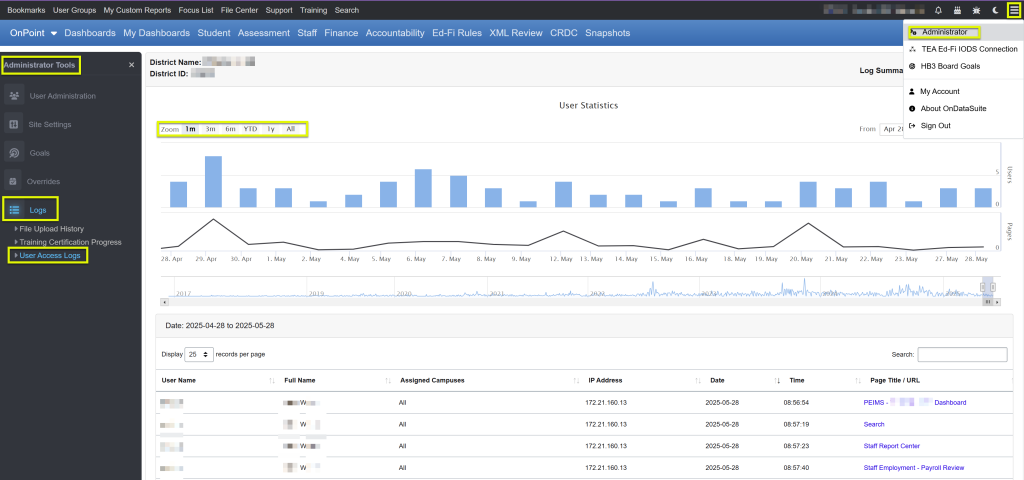
This tab displays analytical data on the usage of the system.
- User Statistics – Default 1 month view
- View bar graph demonstrating daily number of users accessing system
- View longitudinal line graph demonstrating page views over time
- Use Zoom buttons to view 3 months, 6 months, YTD, 1y, or All
- Hover over graph area to see daily Users and Page Views
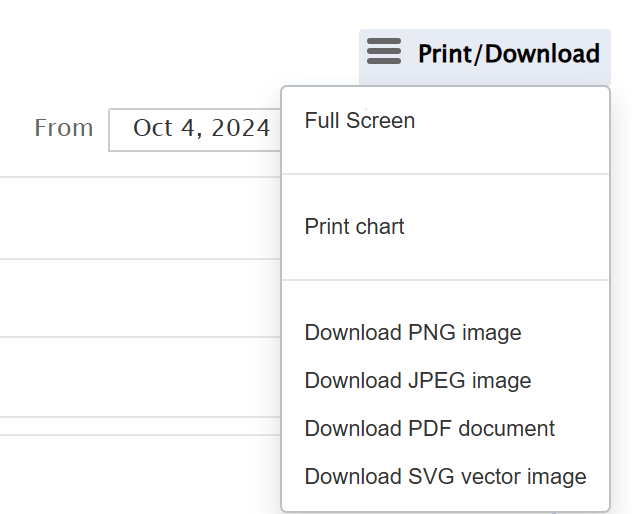
- Use 3 line horizontal button on far right side to print or download graphs
- From and To dates are displayed showing time period displayed
- Slider bar below adjusts to show selected time period
- Use slider bar to manually select time range
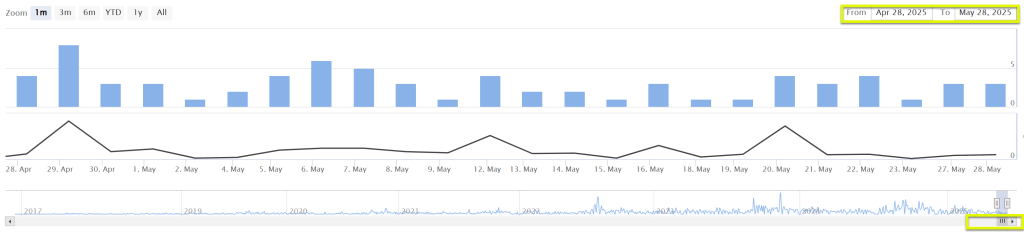
- Graphs readjust to slider bar date range
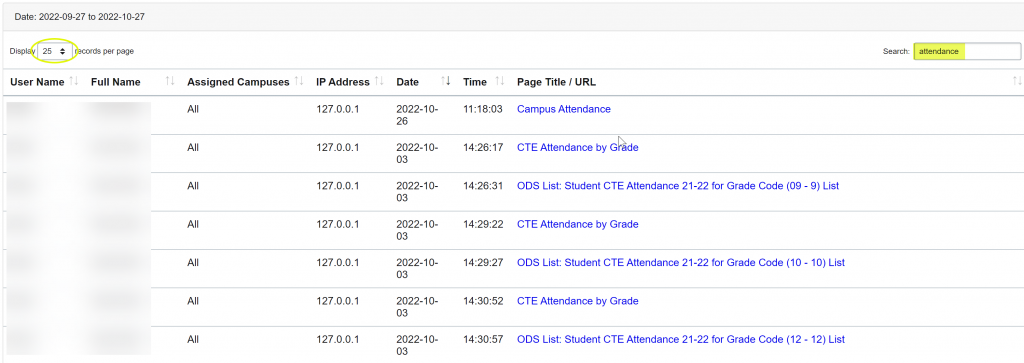
- Date changes update user detailed list below graphs to selected date ranges
- Click on Tools drop-down to Export to Excel
- Use Search to find users or page title/URLs
- Change number of display records to see more information in the detailed list
- Administration Log Summary Viewer – Default Current date
- Toggle to Log Summary On to view summary count of page views by user
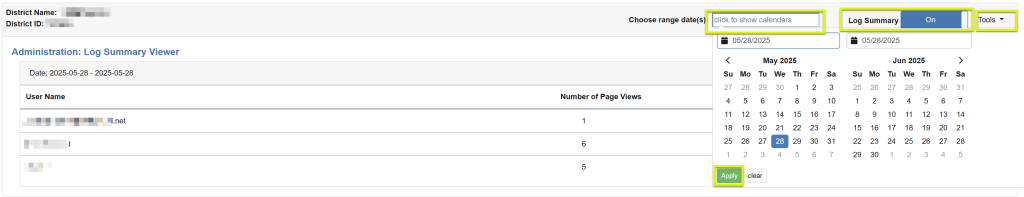
- Click on ‘Choose range date(s):‘ to display calendar
- From date is first date clicked
- To date is next date clicked
- Click ‘Apply‘ button to apply from-to date to user list
- Note: To view a single day, click on the date twice and Apply
- Click on Tools drop-down to Export to Excel