How to Read This Data
The STAAR Average Standard Scores by Ethnicity report shows how different student groups in your district performed on state assessments compared to both state and district averages. This data spans three years (2022-2024) across nine subject areas and provides critical insights for educational planning and equity initiatives.
Key Report Features:
- Displays performance data for all major ethnic groups in your district
- Shows trends over three consecutive years
- Covers elementary through high school assessments
- Uses standardized scoring for fair comparisons
Understanding Standardized Z-Scores in This Report
What Are Z-Scores?
Standardized z-scores convert raw STAAR scale scores into a common measurement system that allows meaningful comparisons across different tests, grade levels, and time periods. Think of z-scores as a universal translator for test performance.
How Z-Scores Are Calculated for This Report
Step 1: Texas Education Agency collects all STAAR scores statewide for each subject area
Step 2: TEA calculates the statewide average (mean) for each test
Step 3: TEA determines how spread out the scores are (standard deviation)
Step 4: Each student’s score is converted using the formula: (Student Score – State Average) ÷ Standard Deviation
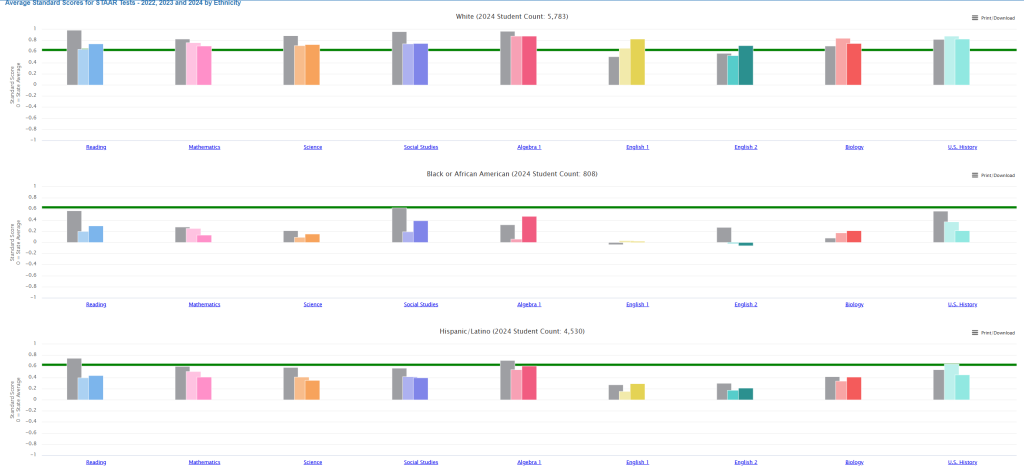
Reading the Visual Elements
The Zero Line (0) = Texas State Average
- All Texas students’ average performance on each STAAR test
- Scores above zero = better than state average
- Scores below zero = below state average
The Green Horizontal Line = Your District’s Overall Average
- How all students in your district performed, regardless of ethnicity
- In this report, your district averages approximately +0.6 across subjects
- This means your district significantly outperforms the state average
The Colored Bars = Each Ethnic Group’s Performance
- Gray bars = 2022 performance
- Light colored bars = 2023 performance
- Darker colored bars = 2024 performance
- Height shows how many standard deviations above or below the state average
What Z-Score Numbers Mean in Practice
- +0.6 (District Average): Students performing at this level score better than approximately 73% of all Texas students
- +0.4: Better than approximately 66% of Texas students
- +0.2: Better than approximately 58% of Texas students
- 0.0: Exactly average with all Texas students (50th percentile)
- -0.2: Better than approximately 42% of Texas students
- -0.4: Better than approximately 34% of Texas students
What This Means for Each Student Group
White Students (5,783 students in 2024)
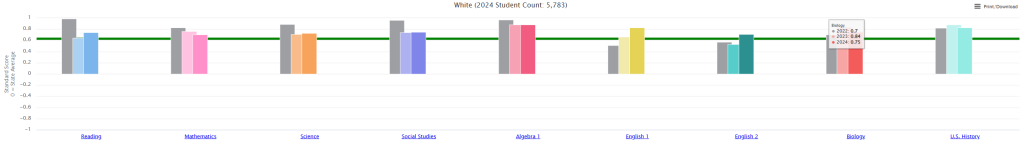
The Good News: This group performs well above both state and district averages in most subjects, especially in math, science, and high school courses. They’re helping drive your district’s strong overall performance.
For Your Classroom: These students likely come to you well-prepared and may need enrichment opportunities to stay challenged.
Performance Relative to State:
- Consistently performs 0.4 to 0.8 standard deviations above state average
- Strongest in Mathematics (+0.7) and Science (+0.7)
- Exceeds state average in all nine subject areas
Performance Relative to District:
- Meets or exceeds district average in most subjects
- Particularly strong in high school End-of-Course exams
- Contributes significantly to district’s overall high performance
Educational Implications:
- Students likely arrive well-prepared for grade-level content
- May benefit from enrichment and acceleration opportunities
- Can serve as peer mentors in collaborative learning environments
Black or African American Students (808 students in 2024)
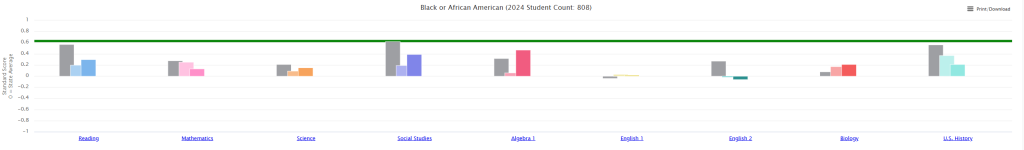
The Good News: These students are performing above the state average in all subjects – they’re doing better than most students across Texas!
The Challenge: They’re still performing below your district’s high standards, with gaps in most subject areas.
For Your Classroom: Focus on building on their strengths while providing targeted support. These students have potential that needs nurturing to reach district-level performance.
Performance Relative to State:
- Performs above state average in all subject areas (0.1 to 0.4 standard deviations)
- Strongest relative performance in Social Studies and Algebra I
- Demonstrates consistent academic achievement above Texas norms
Performance Relative to District:
- Performs below district average across all subjects
- Gap ranges from 0.2 to 0.5 standard deviations below district mean
- Shows steady performance trends across the three-year period
Educational Implications:
- Students have strong foundation above state expectations
- Need targeted support to reach district-level performance standards
- Represent significant opportunity for closing achievement gaps
Hispanic/Latino Students (4,530 students in 2024)
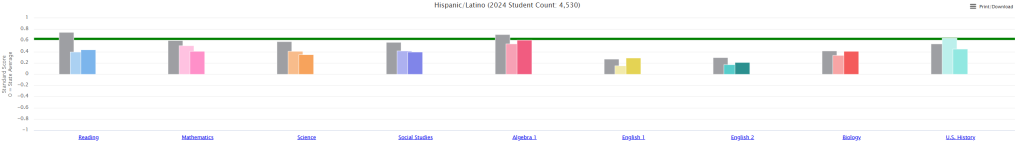
The Good News: This large group also performs above the state average across all subjects, with particularly strong performance in Algebra I and Biology.
The Challenge: Like Black or African American students, they’re performing below the district average in most areas.
For Your Classroom: This is your largest demographic group that needs support to close the gap with district performance. Small improvements here can have a big district-wide impact.
Performance Relative to State:
- Performs above state average in all subjects (0.1 to 0.6 standard deviations)
- Particularly strong in Algebra I (+0.6) and Biology (+0.4)
- Represents largest demographic group in the district
Performance Relative to District:
- Generally performs below district average in most subjects
- Closest to district performance in Algebra I and Biology
- Shows room for improvement in Reading, Mathematics, and Science
Educational Implications:
- Large population means small improvements create significant district impact
- Strong performance in advanced math suggests college readiness potential
- May benefit from culturally responsive teaching practices
Two or More Races Students (548 students in 2024)
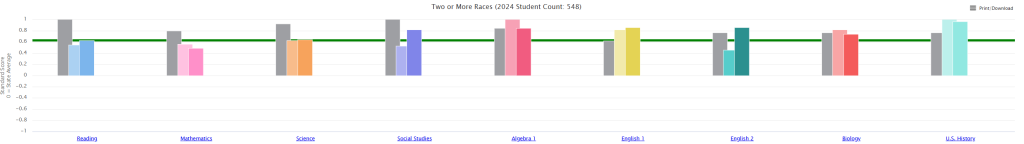
The Good News: This group performs similarly to White students – at or above district averages in most subjects and well above state averages.
For Your Classroom: These students likely need similar approaches to your White students – enrichment and challenge opportunities.
Performance Relative to State:
- Performs 0.4 to 0.8 standard deviations above state average
- Performance pattern very similar to White students
- Consistently strong across all subject areas
Performance Relative to District:
- Performs at or above district average in most subjects
- Particularly strong in high school assessments
- Helps drive overall district performance
Educational Implications:
- Students demonstrate high academic achievement
- May benefit from advanced coursework and enrichment programs
- Can contribute to peer learning initiatives
Practical Applications for Educators
For Classroom Teachers
Expectation Setting:
- All student groups can achieve above-state performance – this is already happening in your district
- Use district averages as realistic stretch goals for all students
- Avoid deficit thinking – focus on building from existing strengths
Instructional Planning:
- Differentiate instruction based on group performance patterns
- Provide additional scaffolding for groups performing below district average
- Offer enrichment for groups meeting or exceeding district standards
Progress Monitoring:
- Small improvements in z-scores represent meaningful learning gains
- Moving from -0.3 to -0.1 is significant progress
- Track trends over time rather than focusing on single data points
For Campus Leaders
Resource Allocation:
- Target interventions for Hispanic/Latino and Black or African American students
- Invest in programs that have shown success with high-performing groups
- Consider peer tutoring programs leveraging student strengths
Professional Development:
- Focus on culturally responsive teaching practices
- Provide training on high-expectation instruction for all students
- Share successful strategies from high-performing demographic groups
Equity Initiatives:
- Address within-district achievement gaps while maintaining high overall performance
- Ensure all students have access to advanced coursework and enrichment
- Monitor progress toward closing performance gaps over time
For District Leadership
Strategic Planning:
- Celebrate overall district success while addressing equity concerns
- Set specific targets for closing achievement gaps
- Maintain focus on keeping all groups above state performance
Communication:
- Help stakeholders understand that “below district average” doesn’t mean “failing”
- Emphasize growth and improvement trends
- Share success stories from all demographic groups
Key Takeaways
District Strengths
- All ethnic groups perform above state averages – exceptional district-wide achievement
- Consistent performance over time – stable, high-quality educational system
- Strong performance in advanced courses – college and career readiness indicators
Areas for Growth
- Achievement gaps within the district – opportunity for targeted improvement
- Varying performance by subject area – need for differentiated approaches
- Equity in advanced performance – ensuring all groups reach district potential
Using This Data Effectively
- Set high expectations for all students based on demonstrated district capacity
- Target resources strategically to close within-district gaps
- Monitor progress regularly using z-score improvements as success metrics
- Celebrate growth and achievement across all demographic groups