Report Location: Finance – Finance Custom Reports > Summary of Finance (SOF) Reports > HB3 Compensatory Education Reports
Summary: State Compensatory Education (SCE) Census Funding Tier student counts compared for the latest five years per TEA defined program reporting and funding requirements. https://kb.ondatasuite.com/knowledge-base/fall-peims-comp-ed-funding-state-compensatory-education-funding-eligibility-and-reporting-requirements/
Usage: Use report to analyze the year to year variations in TEA Census Block Group to Census Tier Mapping rebalancing and any major shifts in student funding by Tier as it pertains to the State Compensatory Education program.
Data Source(s): Fall PEIMS records
- InterchangeStudentExtension
- 40100 – Student Basic Information – Student Extension
- 40110 – Enrollment – Student School Association Extension
Census Block Tier Mapping for 20xx published by TEA.
*NOTE: The Census Tiers are mapped during TSDS Fall PEIMS file loads in OnDataSuite(ODS) based upon the Student Census Block Group and the respective year TEA Census Block Tier Mapping file .
For individual year Tier details, reference the HB3 Compensatory Education – Eco Dis/Census Tiers report.
Definitions:
Tier 1 – 5 funding weights and student counts identified by year.
Total : Total of all SCE funded students Tier 1-5 by year.
Features:
- Filters:
- Years (Default most recent five years of Fall PEIMS data) (multi-select – toggle off or on number of years to report)
- District/Campus (Default All Campuses) (single select)
- Grade Level (Default All Grades) (multi-select)
- Submit – to execute any filter option changes.
- Drill down on counts to see a detailed list of students (blue count hyperlink)
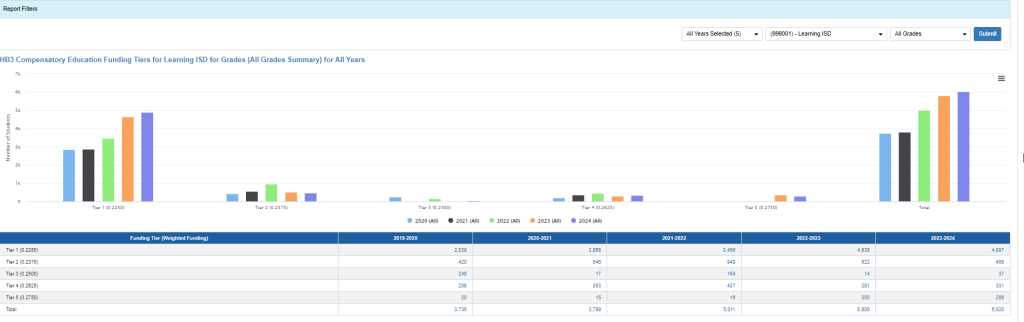
- Graph – default most recent five years
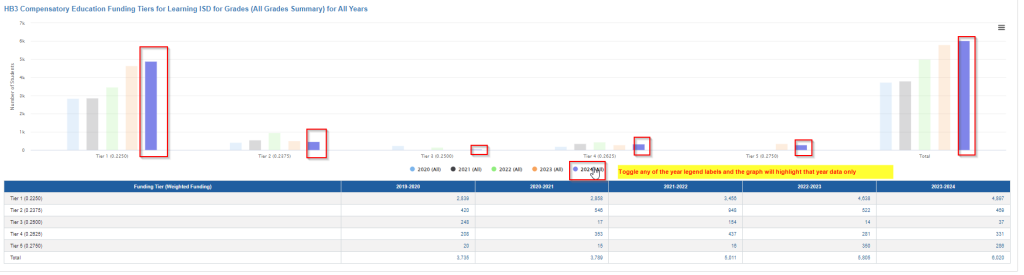
- Graph – toggle by year legend spotlight on graph
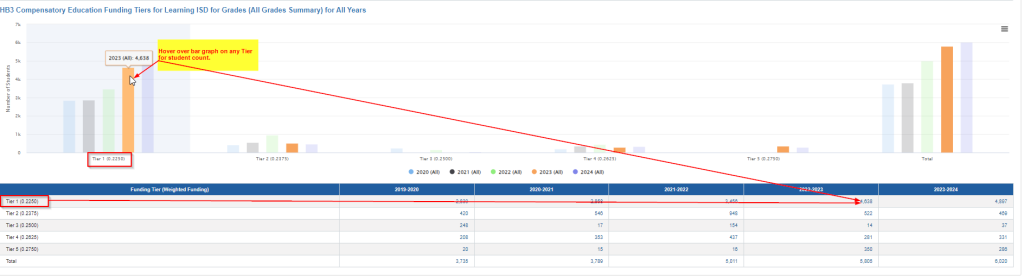
- Graph – Spotlight any specific Tier and Year for Student Counts
- Graphing options: Use hamburger menu on graph
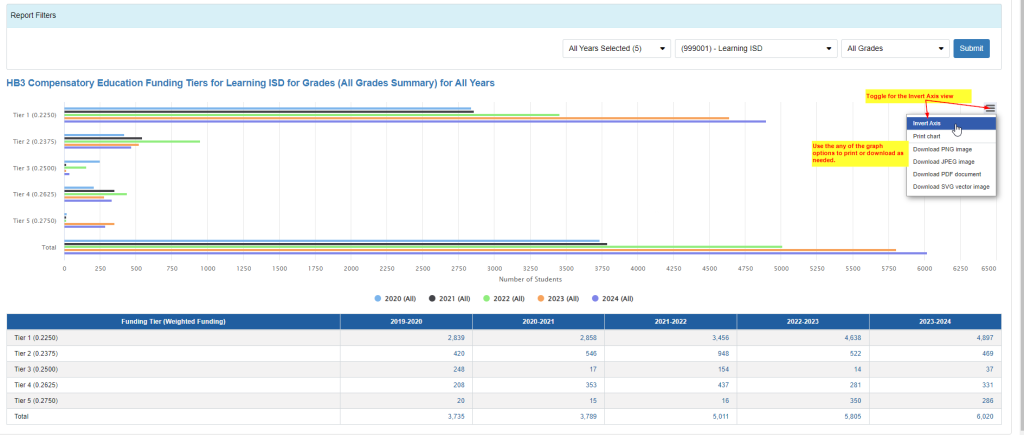
- Tools:
- Export to Excel (native Excel data format – no additional report formatting)
- Bookmark