OnTarget performs a statistical analysis that evaluates each response from each student who took the assessment. Individual students’ performance is compared to all the other students who took the assessment on a question-by-question basis.
Understanding the Basics
Validity means your assessment actually measures what you intended it to measure. If you created a test to assess students’ understanding of fractions, a valid test would truly evaluate their fraction knowledge, not their reading ability or test-taking skills.
Reliability means your assessment produces consistent results. A reliable test would give similar scores if the same student took it multiple times under similar conditions (assuming they didn’t learn more between attempts).
Think of validity as “hitting the target” and reliability as “hitting the same spot consistently.” You want both!
Using OnTarget Reports to Evaluate Your Assessment
OnTarget provides several statistical measures to help you determine if your locally developed assessment is working well. Here’s how to interpret each one:
1. P-Value (Item Difficulty)
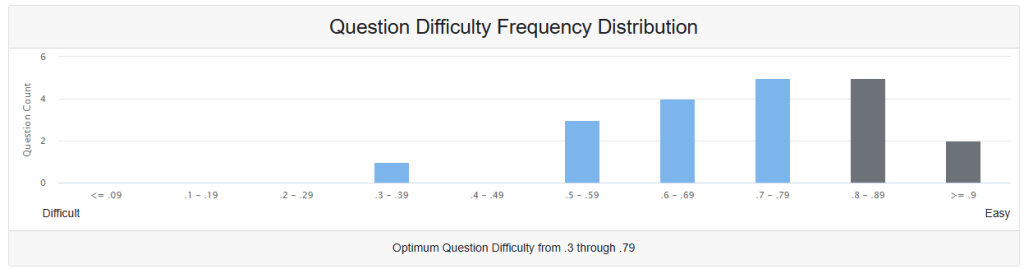
What it is: The p-value shows what percentage of students answered each question correctly. It ranges from 0.00 to 1.00.
How to interpret:
- 0.20 or below: Very difficult question (only 20% or fewer got it right)
- 0.21-0.40: Difficult question
- 0.41-0.80: Moderate difficulty (ideal range)
- 0.81-0.95: Easy question
- 0.96 or above: Very easy question (almost everyone got it right)
What this tells you about validity and reliability:
- For validity: Questions that are too easy (everyone gets them right) or too hard (everyone gets them wrong) don’t help you distinguish between students who understand the material and those who don’t.
- For reliability: A mix of difficulty levels (mostly in the 0.30-0.70 range) creates a more reliable assessment that can accurately rank student performance.
Action steps:
- Review questions with p-values below 0.20 or above 0.90
- Consider if very difficult questions contain unclear wording or test unintended skills
- Consider if very easy questions are too basic for your learning objectives
2. Point Biserial Correlation
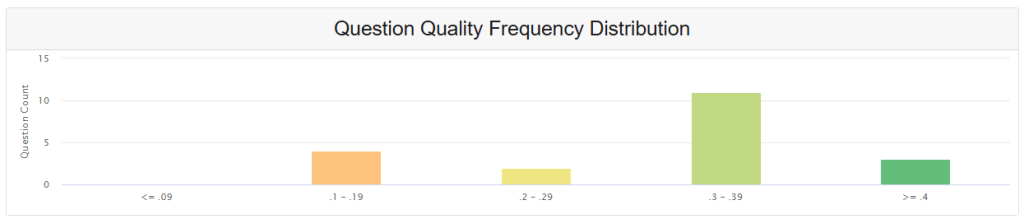
What it is: This measures how well each individual question relates to the overall test performance. It ranges from -1.00 to +1.00.
How to interpret:
- 0.30 or higher: Good – students who did well overall also tended to get this question right
- 0.20-0.29: Acceptable – the question contributes reasonably to the test
- 0.10-0.19: Questionable – the question may not be measuring the same thing as the rest of the test
- Below 0.10 or negative: Poor – this question doesn’t fit with the rest of the assessment
What this tells you about validity and reliability:
- For validity: High correlations suggest all questions are measuring the same underlying knowledge or skill
- For reliability: Questions with low or negative correlations may contain errors, be confusing, or test different content than intended
Action steps:
- Investigate questions with correlations below 0.20
- Check for:
- Confusing wording
- Multiple correct answers
- Content that doesn’t match your learning objectives
- Questions that test different skills than the rest of the assessment
4. Student Performance Demographics
What it is: Analysis of how different groups of students performed on the assessment.
How to analyze:
- Compare performance across different demographic groups
- Look for unexpected patterns or large gaps
- Consider whether differences reflect actual learning differences or assessment bias
What this tells you about validity and reliability:
- For validity: Large, unexpected performance gaps between groups may indicate bias or that the assessment is measuring factors other than the intended learning objectives
- For reliability: Consistent patterns across administrations suggest reliable measurement
Action steps:
- Review questions where certain groups perform unexpectedly poorly
- Consider whether questions contain cultural references, language that may be unfamiliar, or require background knowledge not all students possess
- Examine whether performance differences align with instructional opportunities provided to different groups
5. Question Analysis
What it is: Detailed examination of individual questions and their components.
Key elements to review:
- Distractor analysis: In multiple-choice questions, are wrong answers (distractors) being chosen by students who don’t know the material?
- Response patterns: Are there unexpected patterns in how students responded?
- Content alignment: Does each question clearly address your intended learning objective?
What this tells you about validity and reliability:
- For validity: Questions should clearly test the intended knowledge/skills without requiring unrelated abilities
- For reliability: Well-constructed questions with effective distractors contribute to consistent measurement
Action steps:
- Review questions where distractors aren’t working (no one chooses them, or high-performing students choose them frequently)
- Ensure questions test the intended content depth and complexity
- Check that questions are free from clues that allow students to guess correctly without knowing the material
Putting It All Together: Making Decisions About Your Assessment
When your assessment appears valid and reliable:
- Most p-values fall between 0.30-0.70
- Most point biserial correlations are above 0.20
- No unexpected demographic patterns suggest bias
- Questions clearly address learning objectives
When your assessment needs improvement:
- Multiple questions have very high or very low p-values
- Several questions have low or negative point biserial correlations
- Demographic analysis reveals potential bias
- Questions appear to test unintended skills or contain errors
Quick Action Checklist:
- Start with point biserial correlations – Flag any questions below 0.20 for immediate review
- Check p-values – Identify questions that are too easy or too difficult
- Review flagged questions for:
- Clear, unambiguous wording
- Alignment with learning objectives
- Appropriate difficulty level
- Effective distractors (for multiple choice)
- Examine demographic patterns – Look for unexpected group differences
Remember
Assessment improvement is an ongoing process. Even experienced teachers regularly refine their assessments based on data. Use these tools to make your assessments more fair, accurate, and useful for understanding student learning. When in doubt, consult with colleagues, instructional coaches, or assessment specialists to help interpret your results and make improvements.