The Question Analysis module in OnTarget provides psychometric evaluation of test items through two primary statistical measures: P-value (difficulty) and Point Biserial Correlation (quality/discrimination). This analysis helps educators and assessment professionals evaluate item performance and make data-driven decisions about test construction and item revision.
Question Difficulty: P-Value Analysis
Definition
The P-value (also called p-difficulty or facility index) represents the proportion of examinees who answered a question correctly. It serves as the primary indicator of item difficulty in classical test theory.
Formula
P-value = (Number of correct responses) / (Total number of responses)Calculation Example
- Total examinees: 100
- Correct responses: 75
- P-value = 75/100 = 0.75 (or 75%)
Technical Considerations
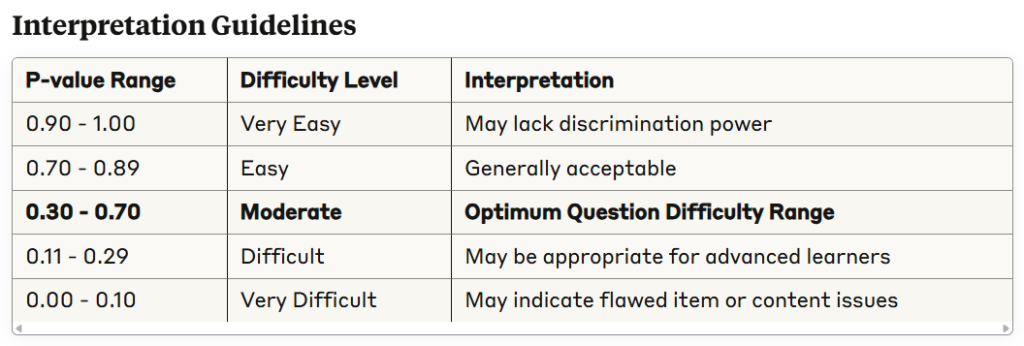
- Higher P-values indicate easier questions (more students answered correctly)
- Lower P-values indicate more difficult questions (fewer students answered correctly)
- OnTarget Optimal Range: 0.30 to 0.70 (Optimum Question Difficulty Range)
- Items outside this range require review for appropriateness and effectiveness
Question Quality: Point Biserial Correlation
Definition
The Point Biserial Correlation (rpb) measures the relationship between performance on a specific item and overall test performance. It indicates how well an item discriminates between high and low-performing students.
Formula
rpb = (Mp - Mq) / St × √(p/q)Where:
- Mp = Mean total score of students who answered the item correctly
- Mq = Mean total score of students who answered the item incorrectly
- St = Standard deviation of total test scores
- p = Proportion answering correctly (P-value)
- q = Proportion answering incorrectly (1 – p)
Alternative Computational Formula
rpb = (∑XiYi - nX̄Ȳ) / √[(∑Xi² - nX̄²)(∑Yi² - nȲ²)]Where:
- Xi = Item score (0 or 1)
- Yi = Total test score
- n = Number of examinees
Calculation Example
Given:
- Students who answered correctly: Mean total score = 85
- Students who answered incorrectly: Mean total score = 70
- Overall standard deviation = 12
- P-value = 0.60 (p = 0.60, q = 0.40)
rpb = (85 - 70) / 12 × √(0.60/0.40)
rpb = 15/12 × √1.5
rpb = 1.25 × 1.225
rpb = 0.31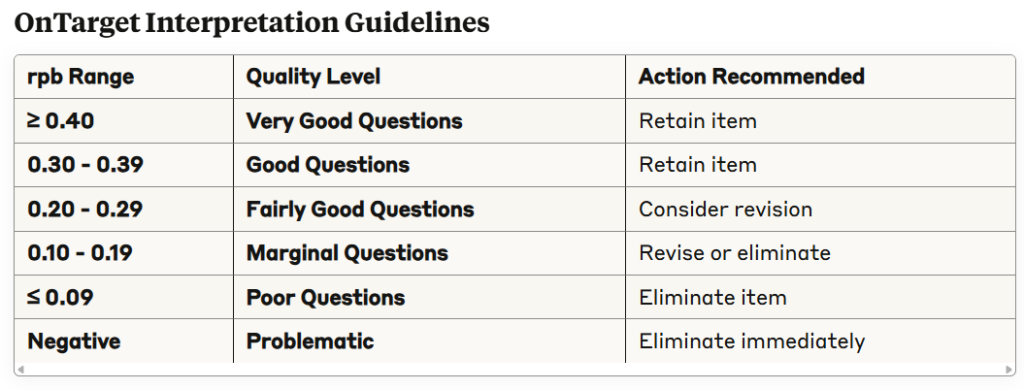
Technical Interpretation
A low point-biserial correlation implies students who answered the item incorrectly also scored high on the overall test, while students who answered the item correctly scored low on the test overall. This indicates the item is not effectively discriminating between high and low-achieving students.
Qualitative Review Components
Purpose and Scope
OnTarget incorporates qualitative review as a method of examining questions to ensure all items meet minimum quality control criteria. The objective is to identify problematic items before they impact assessment validity and reliability.
Common Item Problems Identified
Items may be problematic due to one or more of the following reasons:
- Poor Writing Quality: Items may be poorly constructed, causing student confusion during response
- Visual Clarity Issues: Graphs, pictures, diagrams, or accompanying information may be unclear or misleading
- Answer Key Problems: Items may lack a clear correct response, or distractors could potentially qualify as correct
- Obvious Distractors: Items may contain distractors that most students can easily identify as incorrect, increasing guessing probability
- Content Misalignment: Items may represent different content areas than intended for the assessment
- Bias Concerns: Gender, ethnic, or other group bias may be present in items or distractors
Evidence of Validity Framework
Definition
Validity refers to the extent to which a test measures what it is intended to measure. When test scores are used to make inferences about student achievement, the assessment must support those inferences by measuring the intended construct.
Validity Evidence Sources
According to the TEA Technical Digest (2023-2024), validity evidence can come from multiple sources:
- Test Content: Content adequately reflects the intended construct
- Response Processes: Student cognitive processes align with intended measurement
- Internal Structure: Statistical relationships among items support construct interpretation
- External Relationships: Correlations with other variables support validity claims
- Testing Consequences: Analysis of intended and unintended outcomes
OnTarget Validity Evaluation Criteria
Evidence of validity is measured using the following guidelines:
- TEKS Alignment: Items must align with Texas Essential Knowledge and Skills standards
- Bias and Sensitivity: Items must be free from cultural, gender, or other group bias
- Language and Vocabulary: Appropriate reading level and terminology for target population
- Structure and Context: Clear item construction and meaningful context
- Answer Choices: Plausible distractors and unambiguous correct responses
- Visuals: Clear, accurate, and necessary visual elements
- Data Sources: Reliable and valid source materials
OnTarget Implementation Features
Interface Components
Based on the screenshot, OnTarget’s Question Analysis provides:
- Question Selection: Filter analysis by specific questions or view all questions
- Ordering Options: Sort by question number or statistical values
- Sort Direction: Ascending or descending organization of results
Expected Output Metrics
The analysis displays comprehensive item statistics:
- Question ID/Number: Unique identifier for each item
- P-value (Difficulty Index): Proportion of students answering correctly
- Point Biserial Correlation (Discrimination Index): Quality measure
- Response Distribution: Frequency of selection for each option
- Flagged Items: Questions requiring immediate attention
- Action Taken: Defined action for each individual question (retain, revise, eliminate)
- Notes: Open space for additional comments and recommendations
Data Requirements
- Common Assessment Data File Upload: Required data source containing student responses
- Complete Response Matrix: Individual student responses to all items
- Total Test Scores: Overall performance metrics for correlation analysis
Quality Assurance Standards
OnTarget Acceptable Item Characteristics
For educational assessments using OnTarget criteria:
- P-value: 0.30 – 0.70 (Optimum Question Difficulty Range)
- Point Biserial: ≥ 0.20 (Fairly Good Questions or better)
- Combined Criteria: Items should demonstrate both appropriate difficulty and positive discrimination
- Validity Evidence: Items must meet all seven validity evaluation criteria
Red Flag Indicators
Items requiring immediate review:
- Poor Questions: Point biserial correlation ≤ 0.09
- Extreme Difficulty: P-values below 0.30 or above 0.70
- Negative Discrimination: Any negative point biserial correlation
- Validity Concerns: Failure to meet any of the seven validity criteria
TEA Technical Digest Alignment
The Texas Education Agency Technical Digest emphasizes the importance of:
- Regular item analysis for all state assessments
- Maintaining item quality standards consistent with professional testing guidelines
- Using multiple statistical indices to evaluate item performance
- Continuous monitoring of item characteristics across administrations
Recommendations for Implementation
Regular Analysis Schedule
- Conduct question analysis after each major administration
- Review flagged items before next test administration
- Maintain historical tracking of item performance
OnTarget Decision Matrix
- Optimal P-value (0.30-0.70) + Very Good/Good rpb (≥0.30): Excellent item, retain
- Optimal P-value (0.30-0.70) + Fairly Good rpb (0.20-0.29): Acceptable item, retain with monitoring
- Optimal P-value (0.30-0.70) + Marginal rpb (0.10-0.19): Revise for better discrimination
- Any P-value + Poor rpb (≤0.09): Problem item, eliminate
- Extreme P-value (<0.30 or >0.70) + Any rpb: Review for appropriateness and context
Documentation Standards
- Archive all statistical analyses
- Document decisions for item retention/revision/elimination
- Maintain audit trail for assessment quality assurance
This technical framework ensures that OnTarget’s Question Analysis module provides reliable, valid measures of item performance consistent with professional psychometric standards and state assessment requirements.