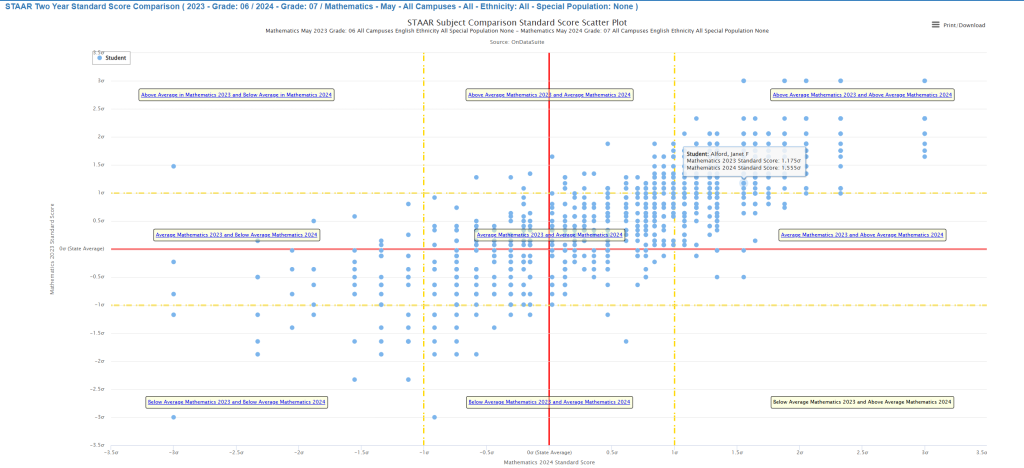
The STAAR Two Year Standard Score Comparison report is a powerful analytical tool that visualizes individual student performance across two consecutive testing cycles using standardized z-scores (standard scores). This scatter plot format allows educators to identify performance patterns, growth trends, and students requiring targeted interventions by comparing their relative position against state performance benchmarks.
Technical Foundation: Standardized Z-Scores
Z-Score Formula and Calculation
The report utilizes standardized z-scores, calculated using the formula:
Z = (X – μ) / σ
Where:
- Z = Standard score (z-score)
- X = Individual student’s raw scale score
- μ (mu) = State mean scale score
- σ (sigma) = State standard deviation
TEA Technical Digest Reference Values
According to the TEA Technical Digest Mean-Values and Internal Consistency Report, the standardization process uses:
- State Mean (μ): The average scale score across all Texas students for each grade/subject combination
- State Standard Deviation (σ): The measure of score variability around the state mean
- Reliability Coefficients: Internal consistency measures (typically Cronbach’s alpha) ensuring measurement precision
Visual Components Analysis
Coordinate System Structure
X-Axis: Mathematics 2024 Standard Score (-3.5σ to +3.5σ) Y-Axis: Mathematics 2023 Standard Score (-3.5σ to +3.5σ)
Reference Lines
- Red Solid Lines: Represent the state mean (z-score = 0) for both years
- Yellow Dashed Lines: Indicate ±1 standard deviation boundaries (z-score = ±1.0)
Critical Importance of Standard Deviation Analysis
Statistical Significance
The standard deviation lines are crucial because they represent:
- 68% Rule: Approximately 68% of students fall within ±1σ of the mean
- 95% Rule: Approximately 95% of students fall within ±2σ of the mean
- Performance Bands: Clear delineation of low, average, and high performance relative to state norms
Practical Applications
- Intervention Identification: Students consistently below -1σ require intensive support
- Gifted Services: Students consistently above +1σ may need advanced programming
- Growth Monitoring: Movement between standard deviation bands indicates meaningful change
Nine-Zone Student Group Analysis
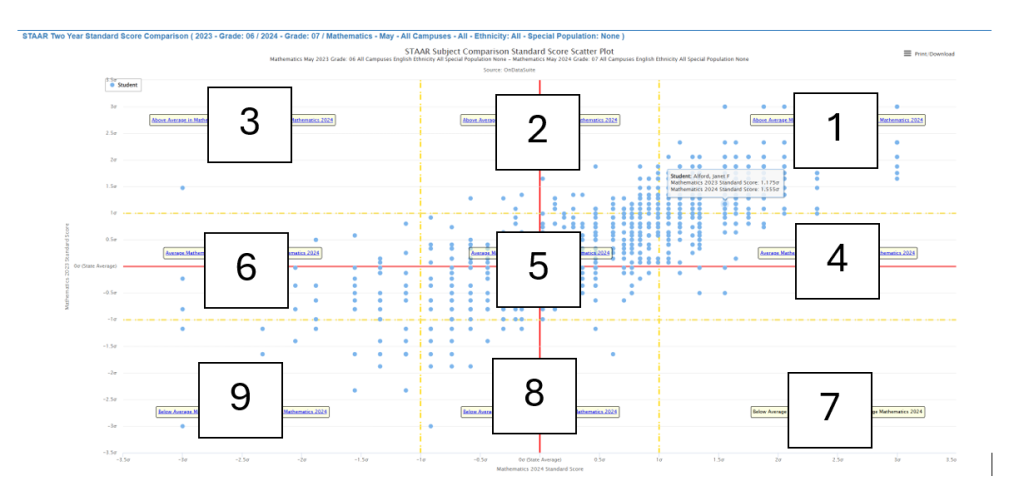
Zone 1: High-High Performance (Upper Right)
Location: Both years >+1σ above state mean Student Characteristics: Consistently high-achieving students (top 16% statewide) Educational Implications:
- Candidates for gifted and talented programs
- May require advanced coursework or acceleration
- Demonstrate sustained academic excellence
Zone 2: High-Average Performance (Upper Center)
Location: 2023 >+1σ, 2024 between -1σ and +1σ Student Characteristics: Previously high-achieving students showing regression toward mean Educational Implications:
- Investigate potential causes of performance decline
- May indicate need for re-engagement strategies
- Consider academic or social-emotional support factors
Zone 3: High-Low Performance (Upper Left)
Location: 2023 >+1σ, 2024 <-1σ Student Characteristics: Significant performance decline requiring immediate attention Educational Implications:
- Critical intervention population
- Investigate external factors (attendance, home circumstances, health)
- Implement intensive academic support immediately
Zone 4: Average-High Performance (Center Right)
Location: 2023 between -1σ and +1σ, 2024 >+1σ Student Characteristics: Students showing substantial academic growth Educational Implications:
- Success story population – analyze effective interventions
- May benefit from continued acceleration opportunities
- Document successful strategies for replication
Zone 5: Average-Average Performance (Center)
Location: Both years between -1σ and +1σ (approximately 68% of all students) Student Characteristics: Consistently average performers relative to state Educational Implications:
- Largest student population requiring differentiated instruction
- Monitor for subtle growth patterns within the average range
- Maintain current instructional approaches while seeking incremental improvements
Zone 6: Average-Low Performance (Center Left)
Location: 2023 between -1σ and +1σ, 2024 <-1σ Student Characteristics: Students experiencing academic decline into below-average performance Educational Implications:
- Early intervention candidates
- May benefit from Tier 2 RTI supports
- Monitor closely for continued decline
Zone 7: Low-High Performance (Lower Right)
Location: 2023 <-1σ, 2024 >+1σ Student Characteristics: Remarkable academic turnaround population Educational Implications:
- Document and replicate successful intervention strategies
- Continue intensive support to maintain gains
- Celebrate and reinforce positive trajectory
Zone 8: Low-Average Performance (Lower Center)
Location: 2023 <-1σ, 2024 between -1σ and +1σ Student Characteristics: Students showing positive movement from below-average to average performance Educational Implications:
- Successful intervention population requiring continued support
- Maintain current strategies while monitoring for sustained growth
- May transition from intensive to moderate support levels
Zone 9: Low-Low Performance (Lower Left)
Location: Both years <-1σ below state mean Student Characteristics: Persistently struggling students (bottom 16% statewide) Educational Implications:
- Highest priority for intensive intervention
- Candidates for special education evaluation if not already identified
- Require comprehensive, multi-tiered support systems
Population Distribution Patterns
Observable Trends from Report Example:
- Central Concentration: Largest density around the origin (0,0) representing average performance
- Positive Correlation: Strong diagonal pattern indicating performance consistency between years
- Outlier Populations: Small but significant groups in extreme performance zones requiring targeted attention
- Growth Indicators: Students above the diagonal line show year-over-year improvement
Data Inclusion Criteria
Critical Requirement: Students must have valid scores for both assessment years to appear on the plot. This ensures:
- Longitudinal validity: Only students with complete data contribute to trend analysis
- Growth measurement accuracy: True year-over-year comparisons
- Intervention targeting precision: Reliable identification of student groups needing support
Strategic Applications for Educators

Resource Allocation
- Zones 3, 6, 9: Priority for intervention resources and staffing
- Zones 4, 7, 8: Study successful practices for system-wide implementation
- Zone 1: Consider advanced programming and enrichment opportunities
Professional Development Focus
- Analyze movement patterns to identify effective teaching strategies
- Target professional development based on student group needs
- Share successful practices from high-growth zones
This standardized approach provides educators with statistically sound, comparable metrics for making informed decisions about student group interventions, resource allocation, and program effectiveness while maintaining alignment with TEA assessment standards and reliability requirements.