Achievement Vs. STAAR Growth Matrix
The Achievement vs. STAAR Growth Matrix report displays a matrix of “Student Performance Level” by “STAAR progress measure.” Students are listed in the matrix depending on how they performed on the assessment in relation to the associated subject STAAR Progress measure was.
Data Source:
Teacher comes from the Class Roster Winter Enrollment collection which must be uploaded into File Center
Note; In Order for the system to calculate the points needed for the student to move to the next level the user must run the report for a specific grade level. There must also be data present for each of the following fields, subject, year, scale score and language. If any of these fields are blank in the data file the system cannot calculate the needed points.
Example
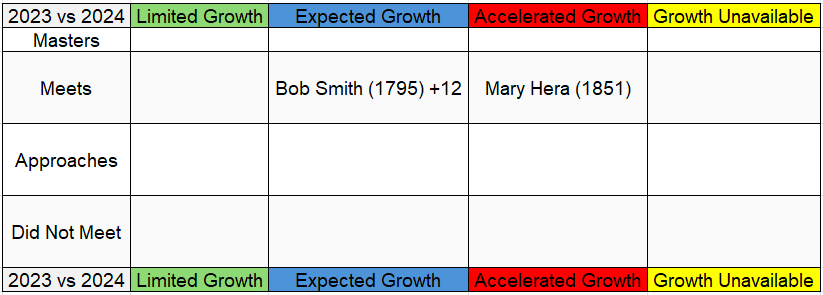
– Bob smith has a scale score of 1795 points; he needs 12 more scale points to move up to the “Accelerated Growth”
– Mary Hera has a scale score of 1851 but the system could not calculate points needed to move up because she has already achieved the highest accelerated growth indicator.
– The report categories and results will vary based on the parameters chosen.