The Compare Dashboard helps you analyze how your students performed on STAAR tests by comparing their results in different ways. It uses a special scoring system that shows whether students performed above, at, or below the state average, making it easier to understand what the numbers really mean.
How the Scoring Works
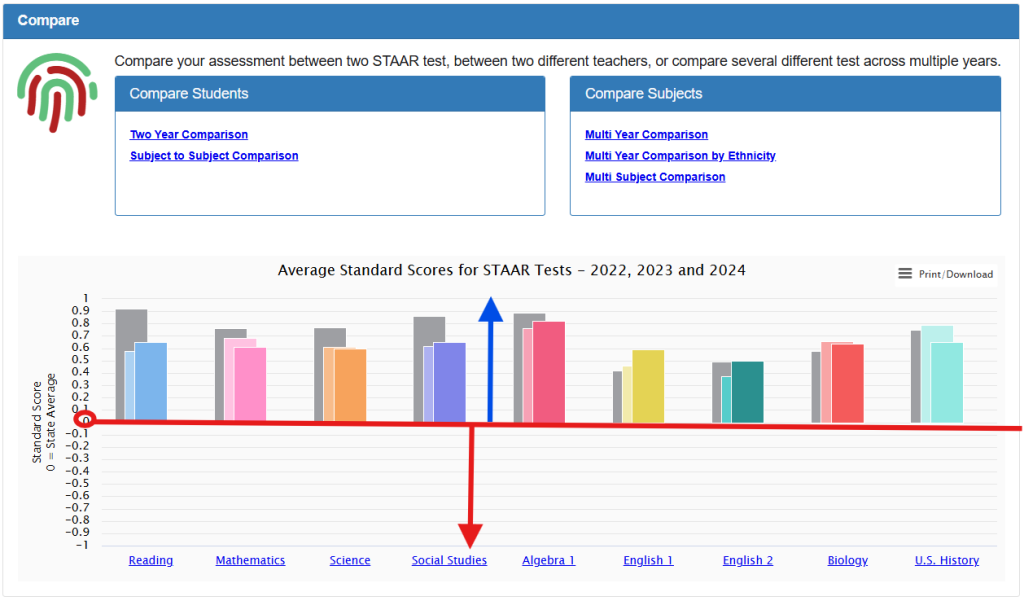
Instead of looking at raw test scores, this dashboard uses standardized scores that compare your students’ performance to all students across Texas. Think of it like a report card where:
- Scores above zero mean students performed better than the state average
- Scores at zero mean students performed right at the state average
- Scores below zero mean students performed below the state average
This system makes it fair to compare different subjects and different years, even when the tests might be slightly harder or easier.
Dashboard Sections
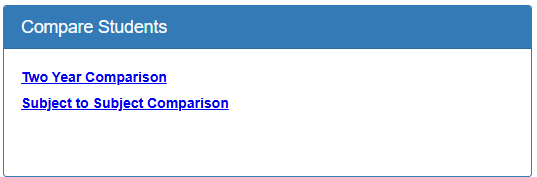
Compare Students Section:
- Two Year Comparison: See how individual students improved (or declined) from one year to the next
- Subject to Subject Comparison: Compare how the same students perform across different subjects like math versus reading
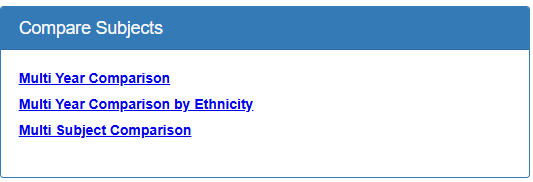
Compare Subjects Section:
- Multi Year Comparison: Track trends over multiple years (2022-2024) to see long-term patterns
- Multi Year Comparison by Ethnicity: Understand how different student groups are performing over time
- Multi Subject Comparison: See which subjects are strengths or areas for improvement
Note: Each of these comparison tools will be explained in detail in separate Knowledge Base Articles with step-by-step instructions and examples.
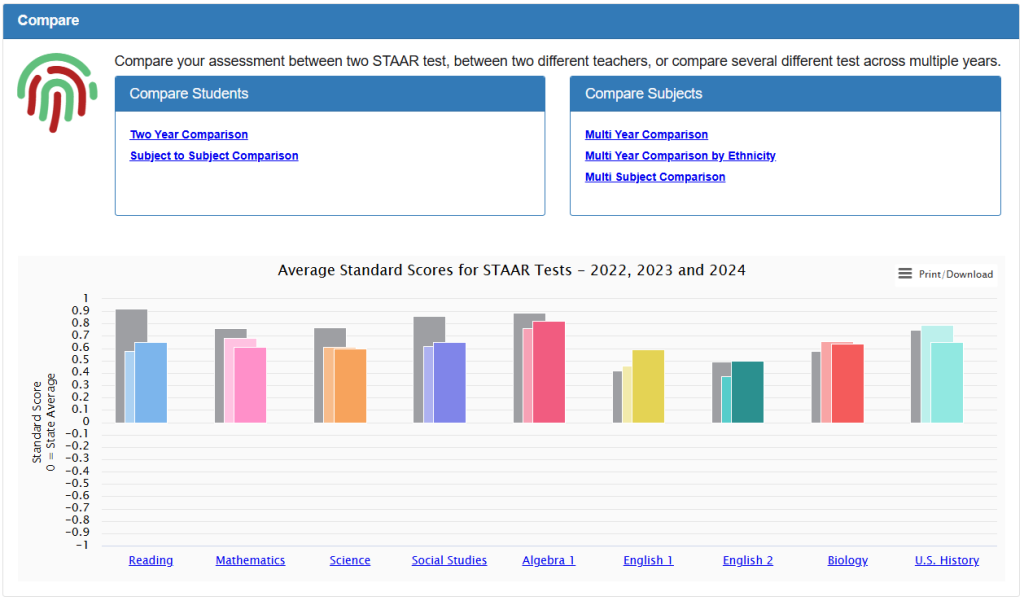
Understanding the Chart
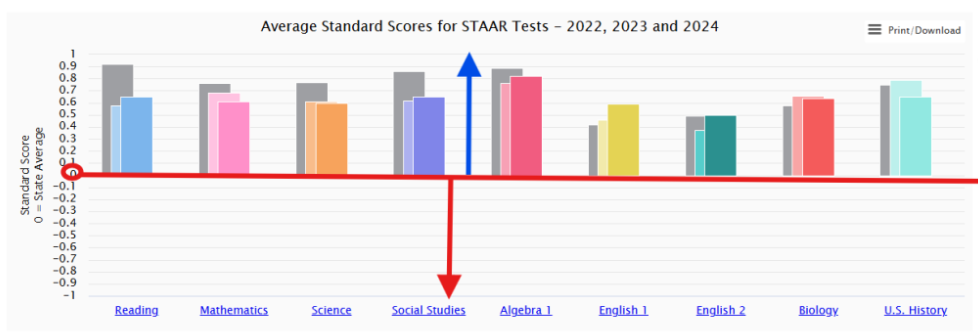
The main chart shows Average Standard Scores for STAAR Tests across three years (2022, 2023, 2024). Here’s what to look for:
- The middle line (zero): This represents average performance statewide
- Bars above the line: Your students performed better than the state average
- Bars below the line: Your students performed below the state average
- Different colors: Each year is shown in a different color so you can track changes over time
- Subject areas: Results are shown for Reading, Mathematics, Science, Social Studies, Algebra 1, English 1, English 2, Biology, and U.S. History
Why This Matters
This standardized approach helps you:
- Make fair comparisons: Compare math scores to reading scores even though they’re different tests
- Track progress over time: See if students are improving year after year
- Identify patterns: Spot which subjects need more attention
- Understand context: Know how your students compare to others across Texas
Data Sources
The scoring system is based on official state data that accounts for differences in test difficulty from year to year and ensures all comparisons are meaningful and reliable.
This dashboard gives you a clear picture of student performance that goes beyond simple pass/fail rates, helping you make informed decisions about instruction and support for your students.