Academic Dashboard
Attendance/Discipline percentage by reporting periods
Attendance and Discipline is displayed by year and six week period.
In the example below the first six week attendance rate fell below the 97% goal set by the district. The red flag icon appears whenever the rate is below the goal. The trend icon indicates the direction of the goal compared to actual attendance rate.
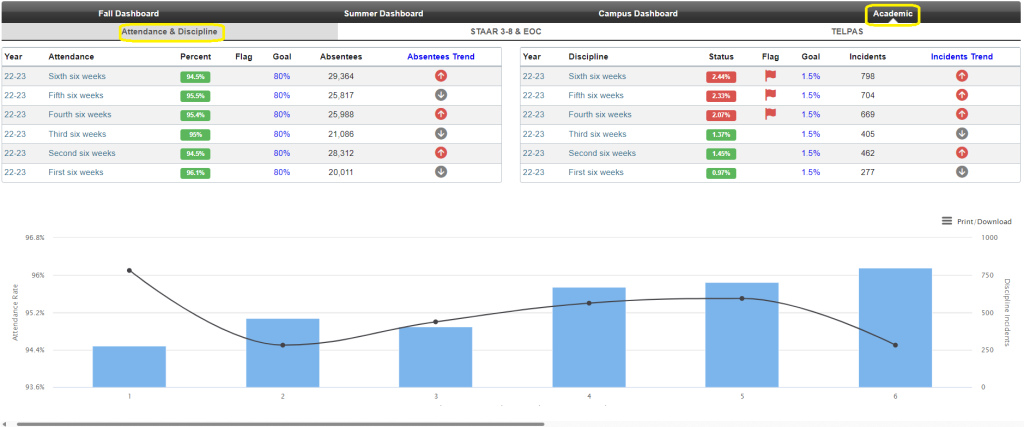
Percent is the Percentage of Attendance (PIA) calculations based on the 42400 day elements.
Sum of (E0937 Total Eligible Days Present + E0936 Total Ineligible Days Present) / Sum of (E0937 Total Eligible Days Present + E0936 Total Ineligible Days Present + E0036 Total Days Absent) * 100
Status – Discipline
Number of students with one or more discipline records (425) divided by the number of students in attendance (400) for a given report period.
In the example above for reporting period 1, 6.29% = 2,247 students with one or more PEIMS reportable discipline incidents / 35,723 Total students with one or more days attendance.