The Compare Dashboard enables comprehensive analysis of STAAR test performance through standardized z-score calculations, allowing for meaningful comparisons across different subjects, years, and student populations.
Standardized Z-Score Implementation
The dashboard utilizes standardized z-scores to normalize STAAR test results, enabling fair comparisons across different test subjects and administration years. The z-score formula applied is:
Z = (X – μ) / σ
Where:
- Z = standardized z-score
- X = raw student/group scale score
- μ = statewide mean scale score for the specific test
- σ = statewide standard deviation for the specific test
Dashboard Components
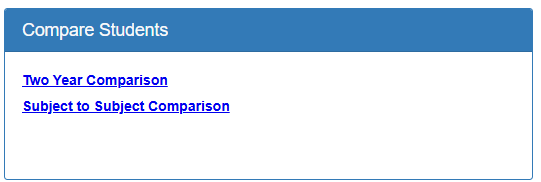
Compare Students Section:
- Two Year Comparison: Analyzes individual student performance across consecutive testing years
- Subject to Subject Comparison: Cross-curricular performance analysis using normalized z-scores
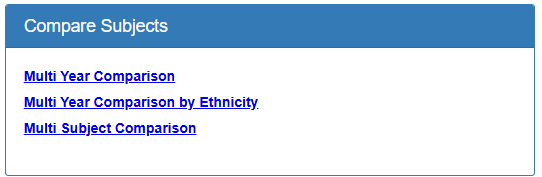
Compare Subjects Section:
- Multi Year Comparison: Longitudinal trend analysis across 2022-2024
- Multi Year Comparison by Ethnicity: Demographic performance analysis
- Multi Subject Comparison: Cross-subject performance evaluation
Chart Analysis Features

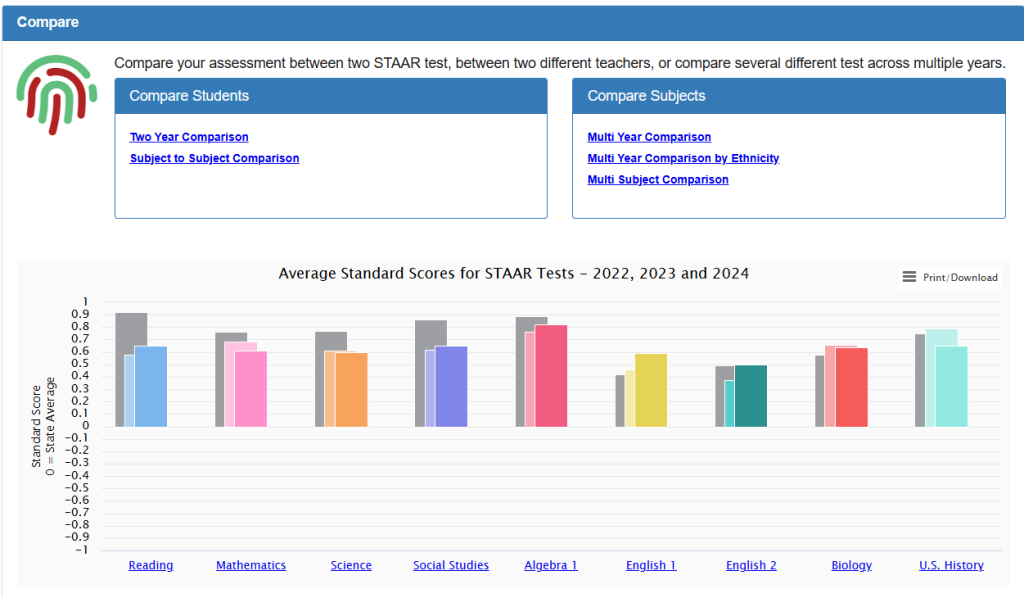
The main visualization displays Average Standard Scores for STAAR Tests (2022, 2023, 2024) with:
- Y-axis scale: -1.0 to +0.9 standard deviations from state mean
- Zero baseline: Represents the statewide average performance (50th percentile)
- Color-coded bars: Different years shown in distinct colors for each subject
- Subject coverage: Reading, Mathematics, Science, Social Studies, Algebra 1, English 1, English 2, Biology, and U.S. History
TEA Technical Reference Integration
The z-score calculations reference TEA Technical Digest Mean Values which provide:
- Annual statewide mean scale scores by subject and grade level
- Standard deviation values for normalization calculations
- Reliability coefficients from internal consistency reports (typically Cronbach’s alpha values)
Statistical Interpretation
Positive z-scores (+0.1 to +0.9): Performance above state average Negative z-scores (-0.1 to -1.0): Performance below state average Zero z-score: Performance at exact state average
The standardization process accounts for:
- Year-to-year test difficulty variations
- Subject-specific scaling differences
- Population demographic changes
This technical framework ensures that comparisons remain valid and meaningful across the diverse STAAR testing landscape, providing educators with reliable data for instructional decision-making.
Note: Each of these comparison components will be discussed individually in separate Knowledge Base Articles with detailed functionality and use case examples.