Report Location: Accountability>State: Accountability Report Center>State Compensatory Education
Student Data Pulled as specified in Texas Equity Toolkit
https://texasequitytoolkit.org/Resource_files/Equity_Gap_Calculation-Updated.pdf

The Equity Gap report pulls the STAAR Progress Measure Percent at Expected or Accelerated Growth by Grade and Subject (All Grades Both Subjects At Expected or Accelerated level) and fall enrollment data for African American (AA), White (W), Hispanic (H), Economically disadvantaged (E), and Non-economically disadvantaged (N) three consecutive school years.
Enrollment data for Non-economically disadvantaged was derived from subtracting the total enrollment and the number of Economically disadvantaged.
Equity Gap Calculation by Ethnicity
Section A: Breakdown by progress measure within declared ethnicity (coded in STAAR as , Black (B), White (W), Hispanic (H))
Section D: Difference or ‘Gap’ between African American to White Total % Met or Exceeds (Values exceeding 10% will result in red cell highlight)
Section E: Difference or ‘Gap’ between Hispanic to White Total % Met or Exceeds (Values exceeding 10% will result in red cell highlight)

Equity Gap Calculation by Economically Disadvantaged
Section B: Breakdown by progress measure within declared Economic Disadvantage Code (coded in STAAR as 1,2,9)
Section F: Difference or ‘Gap’ between Economically Disadvantaged to Non-Economically Disadvantaged Total % Met or Exceeds (Values exceeding 10% will result in red cell highlight)

Equity Gap Overall (All Students – No Exclusions)
Section C: Breakdown by progress measure by All Student group (No Exclusions)

Row Items Explained
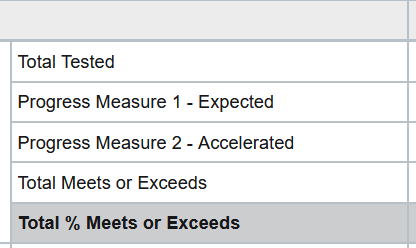
Total Tested
Total number of students that tested within that subpopulation (STAAR and STAAR ALT)
Progress Measure 1 – Expected
Total number of students that tested within that subpopulation (STAAR and STAAR ALT) that had a reading or math progress measure of 1 in the assessment file.
Progress Measure 2 – Accelerated
Total number of students that tested within that subpopulation (STAAR and STAAR ALT) that had a reading or math progress measure of 2 in the assessment file.
Total Meets or Exceeds
Total of Progress Measure 1 (Expected) + Progress Measure 2 (Accelerated)
This value is a unique (non-duplicated) student count. Some students may be in both the expected and the accelerated counts for different subjects, but will show up in this total only one time.
Total % Meets or Exceeds –
Percentage derived from Total Meets or Exceeds / Total Tested