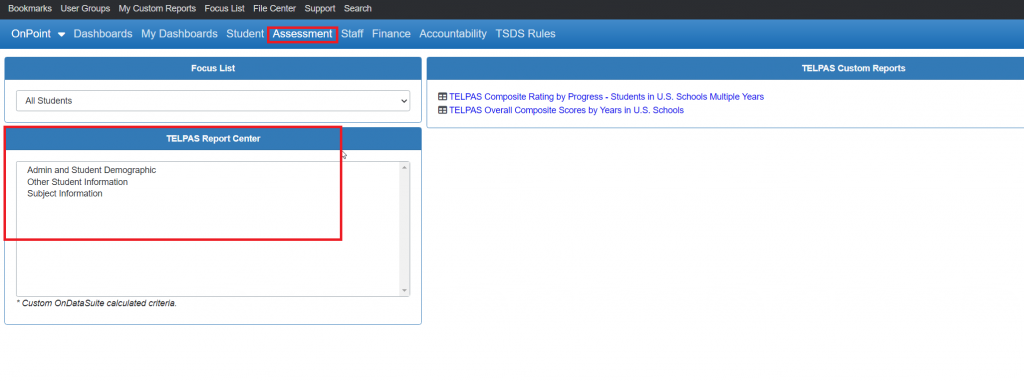
OnPoint provides a intuitive report center that provides our users with a simple, step by step process to help create powerful and informative reports from uploaded TELPAS assessment files. This process begins by accessing the the custom report center menu located on the left hand side of the assessment screen.
Report items are derived from the elements found in the uploaded TELPAS assessment data files and can be drawn by administration data fields or by assessed subject data fields
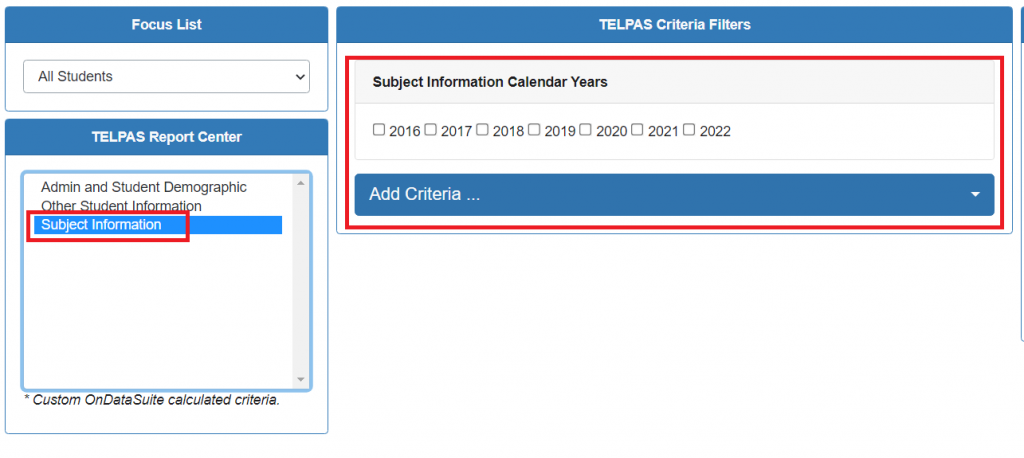
To create a report you must first start with an initial search criteria selection from the report center. This tells the system which data table you want to pull your data from and specifies the number of years you will to include.
When you make your first selection you will see a filter box appear to the right of the report center box. This first filter will show the date ranges of uploaded files available to draw your reports from. If left unchecked, your report will draw from all the years shown.
After you make your initial selection a ‘Criteria: 1’ (shown in green box below) selection option will appear at the bottom of the report center window. These are all of the column items that are available from the first report selection table (Shown in red box below) you selected. Each table contains specific data elements and differ by selection.
You can then begin to add search criteria elements and select filters to refine your report. To see the filter options you must click on the ‘Filter’ link located in the top right hand corner to expand the filter options.
Notice in the example below that for every item selected from the report center window the system will give you a filter option on the right hand side. If you choose not to establish a filter then all available results will be returned.
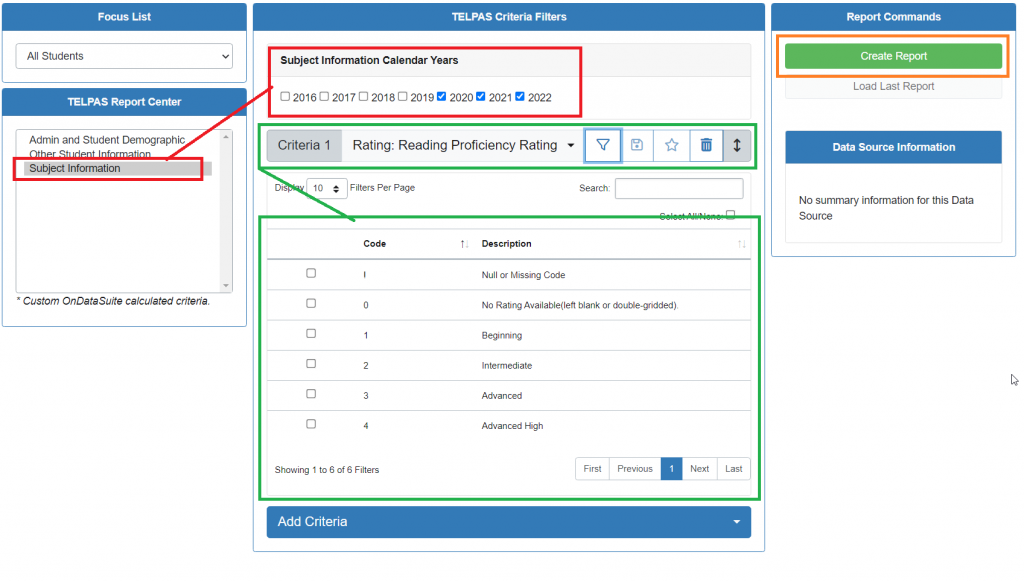
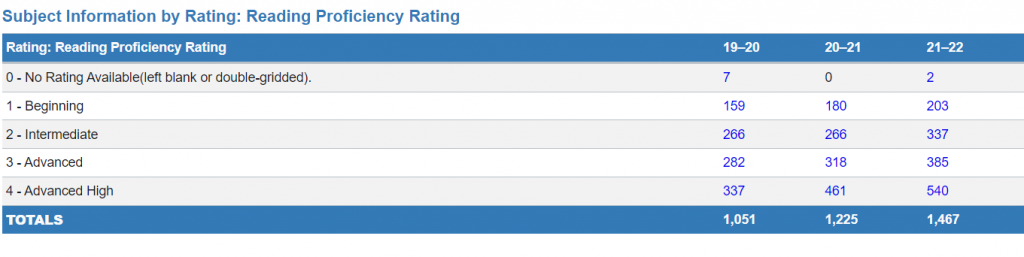
In the example above we are creating a simple report that shows the total number of TELPAS Reading Proficiency Levels for the the years 2020 through 2022, and we did not apply a filter for the ratings.
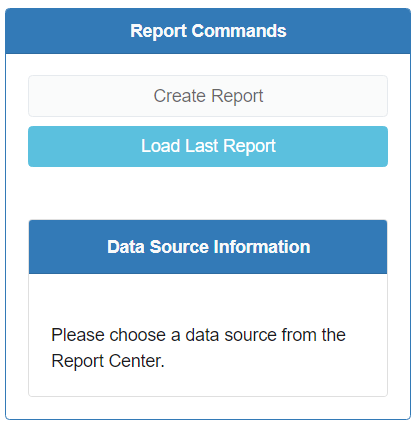
Once you have completed your selection process, click on the ‘Create Report’ button to run the report. Your results will be returned in the form of an overview report based on your selected criteria.
Note: Since we selected only years 2020-2022 and we did NOT select any filters from our proficiency ratings category, the report generated below only shows the selected last three years and displays ALL aggregated reading proficiency ratings.
Adjusting / Refining Your Report
If you need to make adjustments to your report such as adding more filters or refining the selection criteria items, simply click the back button on your web browser and then click the ‘Load Last Report’ button at the bottom of the report center
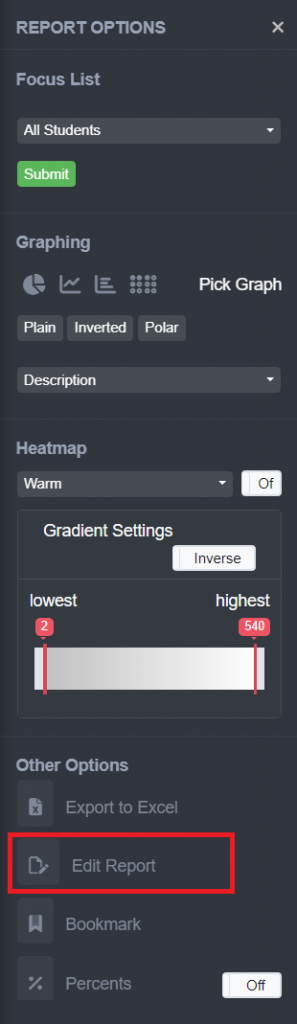
OR you can use the report options side bar menu ‘edit report’ feature to reload the last selections and add/remove/adjust your selections.
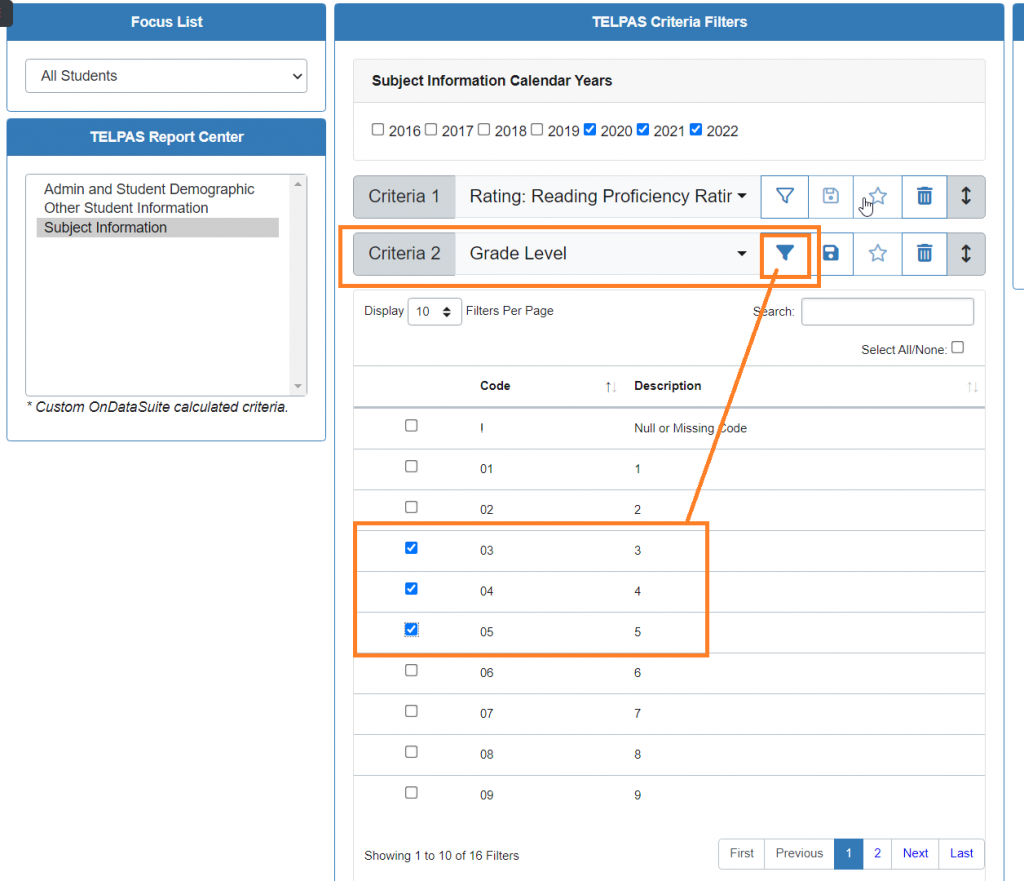
Adding Additional Criteria
After you click the Load Last Report button your initial search criteria should still be held so now you can add a secondary filter criteria to your initial report.
In the example below I have clicked the ‘Edit Report’ button of my side report options menu to bring back my initial report build. Now I am selecting from the Criteria 2 drop down and adding ‘Grade Level’ but this time I am only selecting for grades 03,04 and 05. (Shown in orange box below)