- Available upon creating an adhoc report from the Report Center.
- Located left of report

- Focus List – provides the functionality to apply a focus list to a created ad-hoc report
- Graphing – provides options for visualizing data
- Click on pie, trend line, bar, or bubble graph
- First 5 codes automatically selected
- Hover over graph results to highlight specific codes
- To turn off graph, click on graph image again
- Trend Line and Bar Graphs Only:
- Inverted – switch the X and Y axis
- Polar
- Click legend elements on and off to readjust graph
- Drop-down for legend tags at bottom of graph
- Code
- Description (Default)
- Code-Description
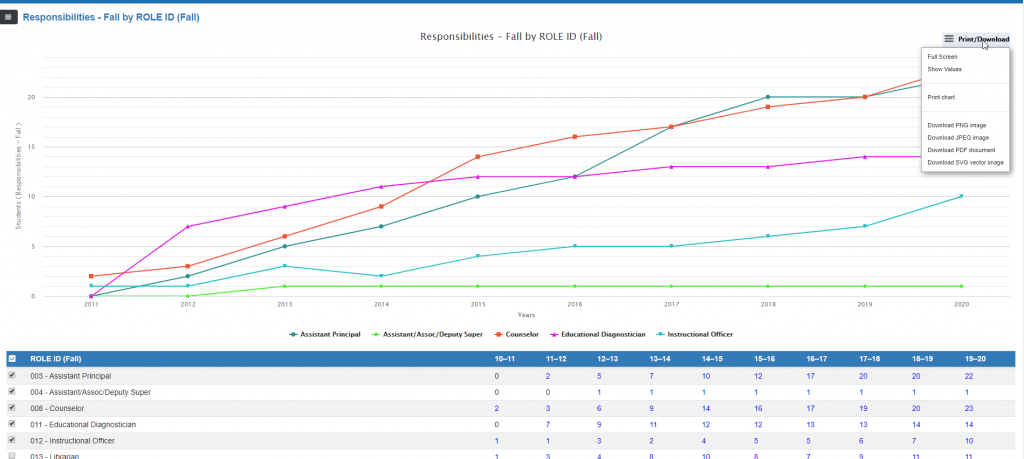
- Click “Print/Download” far right-hand side to:
- “Full Screen” to display only the graph; Click “Exit Full Screen” to return to graph and data chart results
- “Show Values” to display the values on the graph; Click “Hide Values” to remove values
- Print or download the graph in several formats

- Click on pie, trend line, bar, or bubble graph
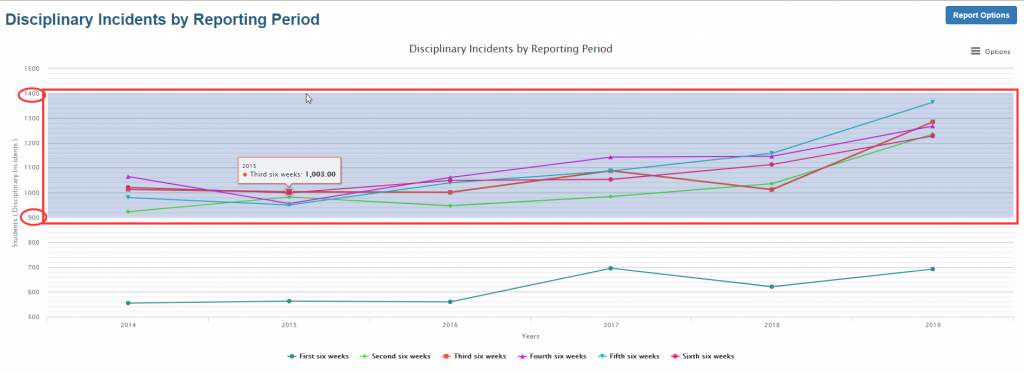
- Zoom (Trend Line and Bar graphs only)
- Highlight desired ‘zoom’ ranges by clicking and dragging within the graph

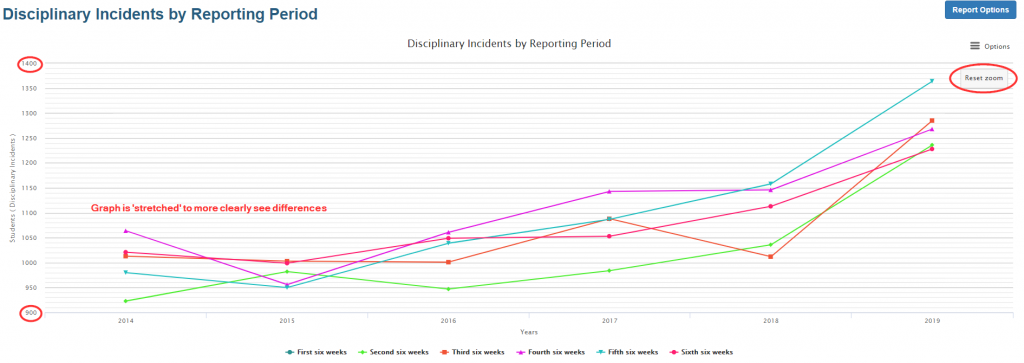
- Zoom Result:

- Click on “Reset zoom” far right hand side to return graph to original state
- Highlight desired ‘zoom’ ranges by clicking and dragging within the graph
- Heatmap – aid in looking for data anomalies

- Export to Excel
- Edit Report – loads report again for modifications
- Bookmark / Sharing – saves the report and the parameter/filters to Bookmarks tab
- Stays updated with the most current data set loaded.
- After clicking Save, report may be shared with other users who have an account.
- Show Percents
- Zeros – display data that have zero values.
- Custom Report -enables rows of data to be used in creating a user custom report.
