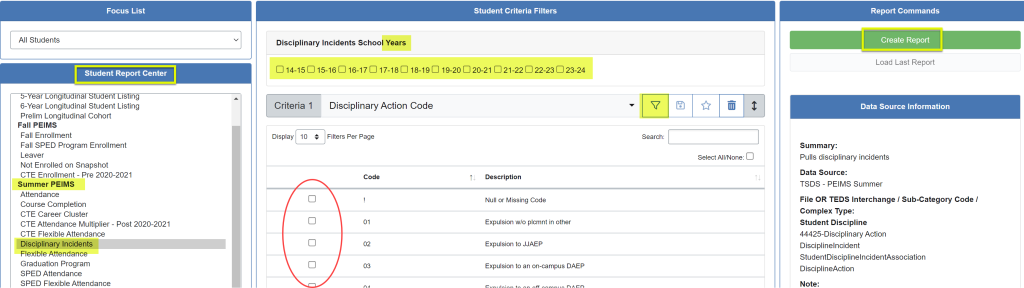
Report Center -is used to build your own “ad-hoc” reports.
- Select the initial “Category”, to begin.
- Use the help “?” for information on each category.
- Select desired year(s), or leave blank to display all.
- Select “Criteria”,
- Includes a list of elements pertaining to the category selected.
- Filter options available – if needed.
- “Create Report”
Student Report Center
Report Options
Only available after an “ad-hoc” report is created. It will be located in the black box on the left of the screen.
NOTE: “x” will close the Report Options screen.

- Graphing – Allows user to graph the data displayed. Select a graph option on the fly, invert and change discriptions,
- Heatmap “On” – Adds color gradients to identify hot spots with option to invert and move the color gradient.
- Other
- Export to Excel – Creates data in a spreadsheet
- Edit – Sends user back to “create report” with options still selected
- Bookmark – Saves the parameters of the report to the bookmarks menu and offers the option to share with other users.
- Show Percent – displays % by column
- Zeros – displays areas that aren’t displaying because of the return of a zero value.