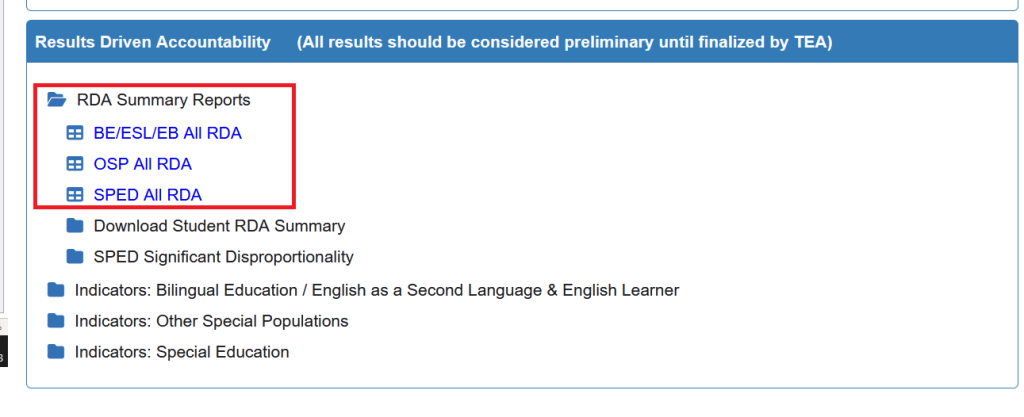
Summary View by Program
Clicking on any RDA summary link will automatically generate the RDA summary overview by selected program at the district or campus level depending on the user privileges:
BE/ESL/EB All RDA
OSP All RDA
SPED All RDA
Horizontal Vs. Vertical Breakdown View
In an effort to provide this report at both the district as well as the campus level, the summary report has been transposed from the way the report is displayed by the state. The state breaks down each indicator value horizontally whereas OnDataSuite shows each indicator vertically at the top of the screen.
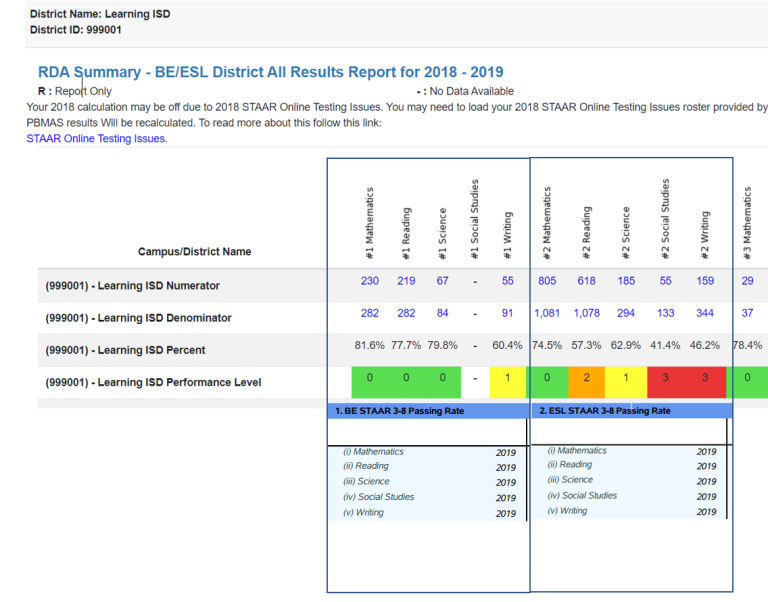
District & Campus Aggregate View
Displaying the data horizontally rather than vertically allows us to aggregate totals for the district as well as provide you with a view of each feeder campus into the district value.
While we understand that individual districts themselves do not receive a performance level value it is helpful to see how each campus contributed to the overall RDA indicator district value.
Report Filter Options
Summary report views are defaulted to the “All Results” view when you first run the report, but there are a few other view options to choose from. To view these options click on the ‘All Results’ drop down button at the top of the report and make a selection, then click the submit button. Options Include:
All Results – Displays all numerator, denominator, percent and color coded performance levels .
Numerator – Only displays the numerator (total tested) values with the associated program
Denominator – Only displays the denominator (total met) values with the associated program
Percent – Only displays the calculated met value ( total met/total tested)
Performance Level – Only displays the color coded assigned performance level.
Tool Options from Student List View
From within the Summary report view there are two tool options you can choose from. To access the list of tool options click on the ‘Tools’ to reveal the drop down selector. Here are the list of options explained.
Export to Excel – Export your reported summary sheet to excel. When this option is selected a window will appear confirming that the file is being created. When it has completed a secondary window will appear notifying you that it is ready to download. Your download link will appear in the bottom left hand corner of the screen. Click on the link and save the file to your local storage of choice.
Bookmark – Bookmark your summary report. This will create a bookmark within your saved bookmark section.