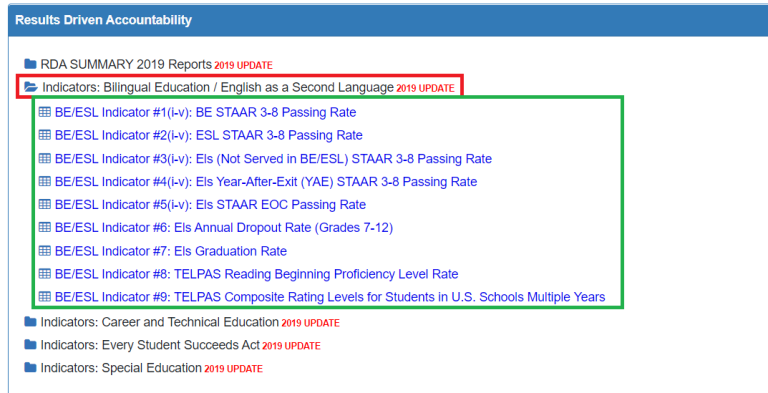
RDA by Indicator Reports
Each RDA program is further broken down by indicator number and can be drilled down to the student level to show students that are not included in the numerator or denominator of the RDA report. In most instances this value represents students that did not meet a passing criteria in state assessments as reported in the RDA.
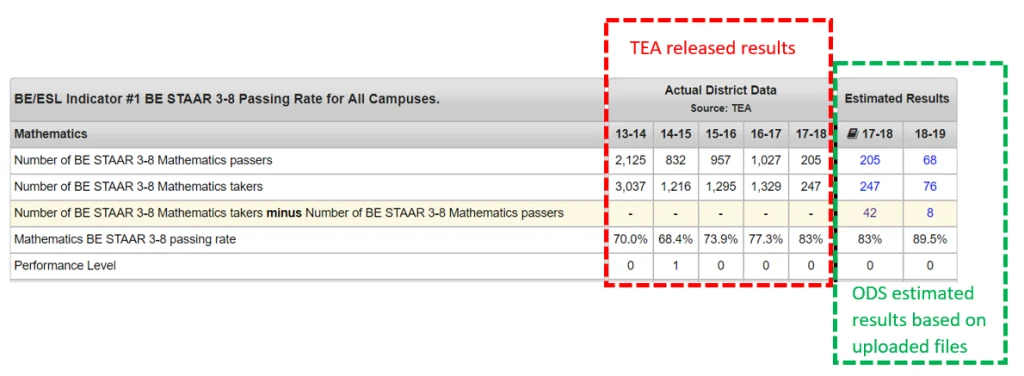
Correlation between Indicator value report and RDA report
After clicking on an individual indicator number your returned report will provide you with a breakdown of total passers, total takers, calculated percentage pass rate and performance level by tested subject. The report layout provides both the official TEA released RDA results on the left side and the Estimated Results on the right side of the report. The TEA values are populated in the system directly from the official TEA release file. The Estimated Results are calculated from the files that you have uploaded into the OnDataSuite File Center.
There can sometimes be a slight deviation between the final release values provided through the RDA report and the Estimated Results calculated through the system. This is usually caused by either missing or ‘updated’ files that the district must still upload into the system. If you find that your Estimated Results numbers are very off from the state released values, first verify that you have uploaded ALL data files available to your district to include all ‘Updated’ files.